EXAMPLES OF HYSIM-CC MODEL USE
Turkey
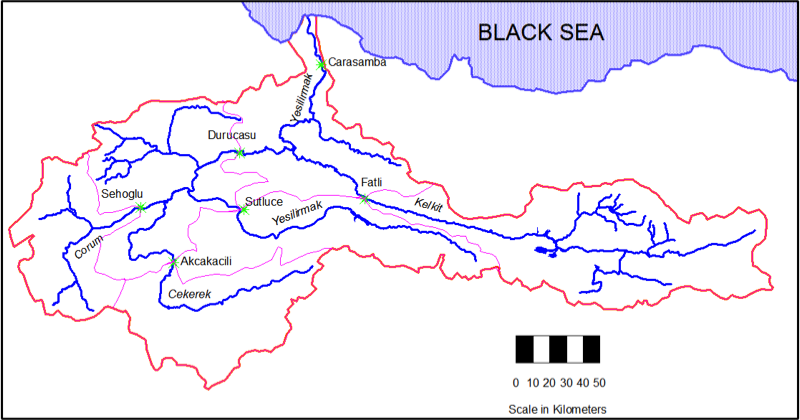
The Yeşilirmak basin in northern Turkey has a drainage area of around 36,000 km2 and flows into the Black Sea. The basin is mountainous with parts of the basin reaching elevations in excess of 2,000m. The aim of the study was to develop an understanding of the water balance of the basin and then to examine the potential effects of climate change on the basin. The basin is heavily developed, mainly for irrigation and hydropower.
Meteorological data were available from two sources. The first source was supplied locally and covered the period 1961 to 2007. The second was from an internationally supported internet site. This source provided data from 1931 to 2006. There was considerable overlap in data from the two sources and we were able to create a consistent data set from 1931 to 2007. Annual precipitation reaches 1000mm/annum near the coast and is less than 500 mm/annum inland. Average annual temperature is around 14 °C to the north of basin and less than 10 °C in higher areas inland.
From 1931 to 2007 the data showed little trend in annual precipitation or temperature but there were differences in seasonal values. Winter precipitation and spring temperature both showed increases.
Reservoirs in the basin play an important part in flow regulation. The total storage is over 5,000 million m3. This is close to the annual average flow of 5,500 million m3/annum. Annual irrigation use is 500 million m3/annum.
The basin was modelled in two ways. First a water resources model was developed which simulated as far as possible the progressive changes in water use and reservoir storage. This model was used to estimate the natural flow in the basin. Secondly the monthly rainfall/runoff model HYSIMM was used to simulate the flows in the basin.
As an initial appraisal of the potential impacts of climate change, the simulated flow for the period 1980 to 1999 was compared with simulated flow for projected values for the period 2080 to 2099, i.e. 100 years in the future relative to observed. The climate projections were based on the IPCC task force on Data and Scenario Support 2007 report “General Guidelines On The Use Of Scenario Data For Climate Impact And Adaptation Assessment”. The SresA1B scenario, which assumes rapid growth and a balanced use of energy sources, was used.
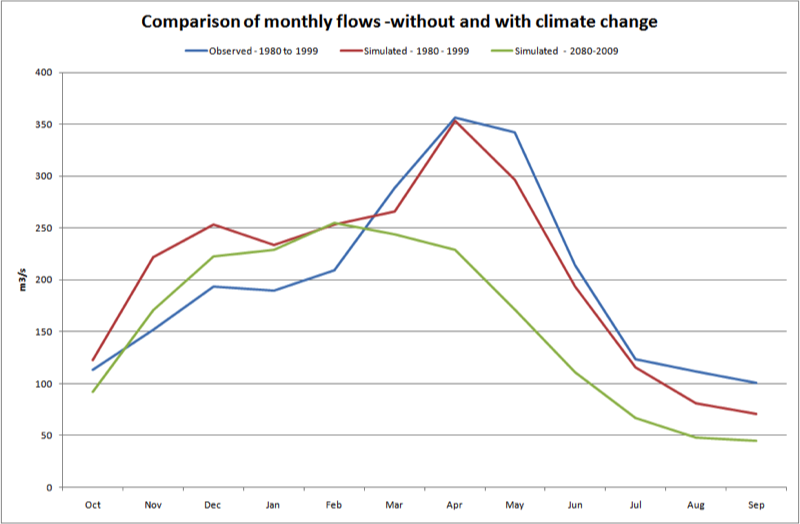
This shows that in this basin the main effect of climate change will be a reduction in spring flows. The flow reduction continues well into the growing season with implications for the need for reservoir storage in the basin.
Spain/Portugal
Background
As part of a project on 'Resource and Economic Efficiency of Water Distribution Networks in the EU' a study was carried on the impact of climate change of the Tajo/Tejo basin in Spain and Portugal, with particular reference to the Portuguese section.
Objectives
The overall objective to to examine efficiency of water resource use under climate change scenarios. To do this a hydrological model was calibrated to the Tajo (in Spain) and Tejo (in Portugal).
Activities
The HYSIM hydrological model was calibrated to 4 flow stations in Spain and 11 in Portugal. In addition flows were estimated at 4 ungauged sub-catchments using parameters from adjacent sub-catchments.
To derive a flow record for calibration to the observed flows were naturalised to take account of abstractions, discharges and reservoir storage.
Flows were simulated with observed rainfall and potential evapotranspiration from 1971 to 2009.
Projected flows were simulated using the A1B, A2 and B1 scenarios with seven different models, following the recommendations of the IPCC scenarios working group.
Results
Flows in the basin are heavily modified by artificial influences. In all case and with all scenarios the impact of the artificial influences was much larger than that of climate change.
Mekong Basin
Background
The Mekong River rises in a mountainous area of China and flows for 4,909 km through Myanmar, Thailand, Laos, Cambodia and Vietnam. Its catchment area is 795,000 km2.
Objectives
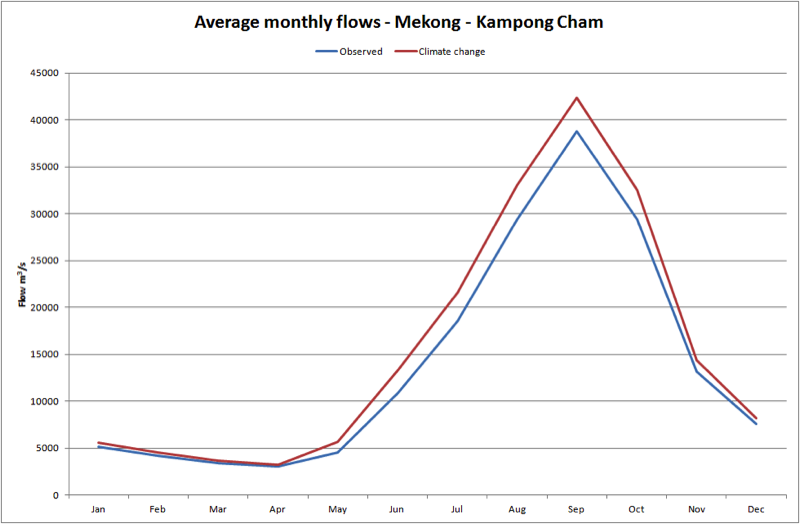
As part of a project examining the impact of climate change on rural roads in Cambodia and ways of climate proofing them it was necessary to study the Mekong River through Cambodia. An important objective was to quantify changes in flooding due to climate change.
Results
Daily rainfall and climate data were obtained, mainly from web sites of international sources, for the whole of the Mekong basin. They covered the period 1975 to 2011.
The HYSIM rainfall runoff model was calibrated to the following sites:
Flows for the two periods were compared which suggested that for this model/scenario combination peak flows would increase.
The Mekong River rises in a mountainous area of China and flows for 4,909 km through Myanmar, Thailand, Laos, Cambodia and Vietnam. Its catchment area is 795,000 km2.
Objectives
As part of a project examining the impact of climate change on rural roads in Cambodia and ways of climate proofing them it was necessary to study the Mekong River through Cambodia. An important objective was to quantify changes in flooding due to climate change.
Results
Daily rainfall and climate data were obtained, mainly from web sites of international sources, for the whole of the Mekong basin. They covered the period 1975 to 2011.
The HYSIM rainfall runoff model was calibrated to the following sites:
- Chiang Saen
- Chiang Khan
- Mukdahan
- Pakse
- Stung Treng
- Kratie
- Kampong Cham
Flows for the two periods were compared which suggested that for this model/scenario combination peak flows would increase.
Vanuatu
Vanuatu is a chain of islands in the Pacific Ocean. They lie about 1800 km to the east of Australia and a similar distance to the North of New Zealand.
There are 82 islands of which 62 are inhabited. The islands can experience cyclones during the period December to April. The objective of the project I was working on was to increase the resilience of the road network to the impact of climate change. The project concentrated on four of the islands: Pentecost, Ambae, Melekoula and Tanna.
There are 82 islands of which 62 are inhabited. The islands can experience cyclones during the period December to April. The objective of the project I was working on was to increase the resilience of the road network to the impact of climate change. The project concentrated on four of the islands: Pentecost, Ambae, Melekoula and Tanna.
Daily rainfall data were available for three of the four islands and for Efate, where the capital city and the country’s main airfield is situated. All four islands have a network of roads, mainly un-paved but with enhanced drainage. In many cases stream crossings were provided by a concrete road surface set so that the crossing was at the level of the stream and, therefore, lower than the adjoining road.
A preliminary regional study of climate change had been carried out by the Pacific -Australia Climate Change Science & Adaptation Planning (PACCSAP) financed by the Australian government. This program had identified three global climate models as being appropriate: GISS, CNRM and ACCESS. Projections of temperature and precipitation were downloaded for these three models. It was decided to concentrate on the Representative Concentration Pathway of 6.0 W/m2, this being taken representing a ‘business-as-usual’ future development of anthropogenic forcing.
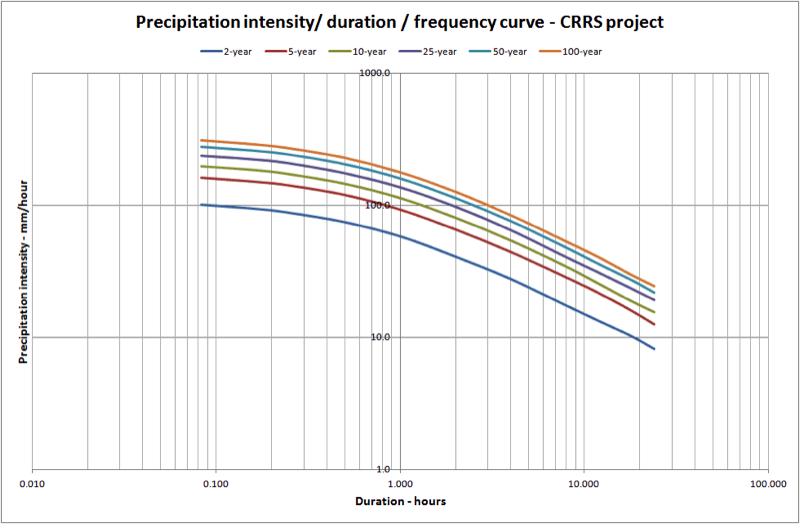
The drainage areas of stream s crossing the roads are small, tens of square kilometres at the most and sometimes less than 10 square kilometres. The approach used was to estimate a frequency/duration/intensity curve for each of the four islands using observed meteorological data and the to examine how the curve changed under projected climate values. For the change in rainfall two elements were considered: the first was the increase in monthly rainfall, which was assumed to be in the same proportion for the whole month and the second was to allow for an increase in storm precipitation linked to the increase in temperature. For this we based our projections on the work of O’Gorman O’Gorman: ‘Sensitivity of tropical precipitation extremes to climate change’ in Nature Geoscience Letters, September 2012. This suggested that precipitation in storms increases by up to 10% per degree Celsius of increased temperature. As the model cells covered areas of 1000s of square kilometres the uses of RX1, maximum daily precipitation, values was not appropriate given the small size of stream drainage areas.
What we found was that while the islands had different annual rainfall averages the storm precipitation varied relatively little from island to island. This enabled us to develop an ‘envelope’ appropriate to all four islands. The resulting curve is shown below.
A preliminary regional study of climate change had been carried out by the Pacific -Australia Climate Change Science & Adaptation Planning (PACCSAP) financed by the Australian government. This program had identified three global climate models as being appropriate: GISS, CNRM and ACCESS. Projections of temperature and precipitation were downloaded for these three models. It was decided to concentrate on the Representative Concentration Pathway of 6.0 W/m2, this being taken representing a ‘business-as-usual’ future development of anthropogenic forcing.
The drainage areas of stream s crossing the roads are small, tens of square kilometres at the most and sometimes less than 10 square kilometres. The approach used was to estimate a frequency/duration/intensity curve for each of the four islands using observed meteorological data and the to examine how the curve changed under projected climate values. For the change in rainfall two elements were considered: the first was the increase in monthly rainfall, which was assumed to be in the same proportion for the whole month and the second was to allow for an increase in storm precipitation linked to the increase in temperature. For this we based our projections on the work of O’Gorman O’Gorman: ‘Sensitivity of tropical precipitation extremes to climate change’ in Nature Geoscience Letters, September 2012. This suggested that precipitation in storms increases by up to 10% per degree Celsius of increased temperature. As the model cells covered areas of 1000s of square kilometres the uses of RX1, maximum daily precipitation, values was not appropriate given the small size of stream drainage areas.
What we found was that while the islands had different annual rainfall averages the storm precipitation varied relatively little from island to island. This enabled us to develop an ‘envelope’ appropriate to all four islands. The resulting curve is shown below.