GASES
Water Vapor, Carbon Dioxide (CO2), Ozone (O3), Methane (CH4) and Nitrous Oxide (N2O) are generally considered to be the most important greenhouse gases.
In this section of the website we provide information on the following greenhouse gases:
Although people speak of “greenhouse” gases, and like glass in a greenhouse they keep the earth warmer than would otherwise be the case, the way they heat the atmosphere is not like that of glass in a greenhouse. While the sun is shining on the earth it heats up as a result of incoming short-wave radiation; as the earth heats up it gives off some of that heat in the form of outgoing long-wave radiation. Just as photographic filters can block light of specific wave-lengths so the “greenhouse“ gases absorb heat in specific wave-lengths and stop it from leaving the earth. Figure 1 shows the outgoing heat radiation at ground level, the radiation which “escapes” to space and the effect of greenhouse gases.
http://www.climatedata.info/
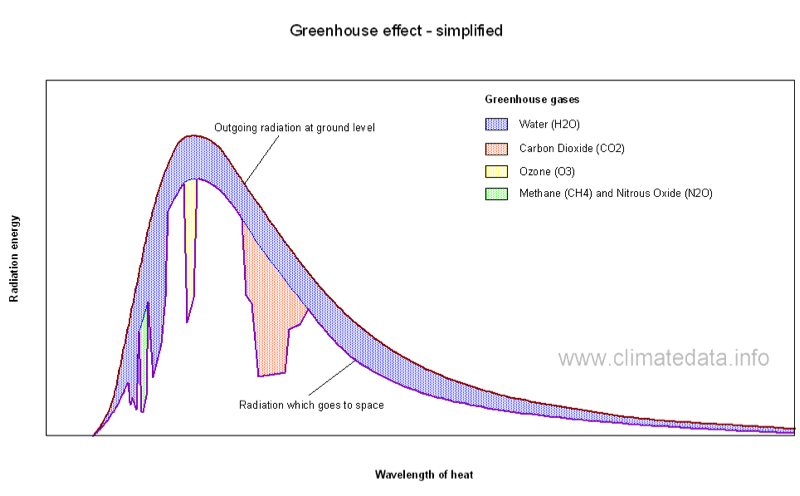
As can be seen water vapor is the most effective greenhouse gas and operates over most of the relevant wave-length. Although this simplified graph suggests that its effect is fairly uniform that is not actually the case; there are some intermediate wave-lengths with higher or lower effects. Carbon dioxide is the next most powerful greenhouse gas. Whereas water vapor is effective over a wide range, carbon dioxide is only effective over a limited part of the wave-length. As concentrations of carbon dioxide increase it will absorb a higher proportion of the outgoing heat within its wave band but its effect will not spread to other wave lengths. Similar considerations apply to Methane and Nitrous Oxide. In fact, they both operate over the same relatively narrow wave band.
Figure 2 shows a slightly more realistic representation of the greenhouse effect. This demonstrates some of the variation in absorption mentioned above. It also shows that the effect of water vapor, the most important greenhouse gas, varies depending on whether the sky is clear or cloudy.
Figure 3 shows the relative contributions of different greenhouse gases.
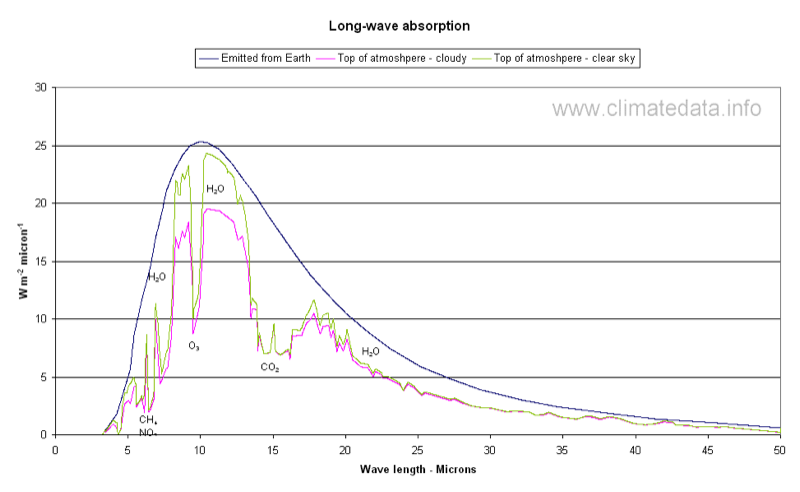
All figures above, are based on Kiehl and Trenberth, Earth’s Annual Global Mean Energy Budget, Bulletin of the American Meteorological Society, Vol. 78, No. 2, February 1997. The way these figures have been derived is not exact and should be considered as a general guideline. Figures 1 ad 2 demonstrate there is some overlap of the wavelengths over which different gases absorb radiation. For example, water vapor has an effect over the wavelengths of most of the other gases. Nitrous oxide and methane operate over the same narrow band. The percentage contribution is based on ‘sharing’ the effect when wavelengths overlap . The percentage also varies depending on whether sky is clear or cloudy.