VOLCANOES
Major volcanoes can have a significant effect on the earth’s temperature. An eruption carries ash and gases into the upper atmosphere. In particular sulphuric gases convert to sulphate aerosols which are a significant factor in cloud formation. These can reduce global temperatures for up to three years. The magnitude of a volcano is given by the Volcanic Explosivity Index (VEI); the equivalent of the Richter scale for earthquakes. Like the Richter scale it is logarithmic. It is based mainly on the volume of tephra, ejected material, with each step representing an order of magnitude increase in volume.
The following table list all volcanoes with an index of 5 or greater since 1800:
The following table list all volcanoes with an index of 5 or greater since 1800:
| Volcano | Location | Latitude | Year | VEI |
| ST. HELENS | USA, Washington | 46.2 ºN | 1800 | 5 |
| TAMBORA | Indonesia, Lesser Sunda Islands | 8.25 ºS | 1815 | 7 |
| GALUNGGUNG | Indonesia, Java | 7.25 ºS | 1822 | 5 |
| COSIGUINA | Nicaragua | 12.98 ºN | 1835 | 5 |
| SHIVELUCH | Russia, Kamchatka Peninsula | 56.65 ºN | 1854 | 5 |
| ASKJA | Iceland | 65.03 ºN | 1875 | 5 |
| KRAKATAU | Indonesia | 6.10 ºS | 1883 | 6 |
| OKATAINA | New Zealand | 38.12 ºS | 1886 | 5 |
| SANTA MARIA | Guatemala | 14.76 ºN | 1902 | 6 |
| KSUDACH | Russia, Kamchatka Peninsula |
51.80 ºN | 1907 | 5 |
| NOVARUPTA | USA, Alaska Peninsula | 58.27 ºN | 1912 | 6 |
| AZUL, CERRO | Chile | 0.92 ºS | 1932 | 5 |
| KHARIMKOTAN | Kuril Islands | 49.14 ºN | 1933 | 5 |
| BEZYMIANNY | Russia, Kamchatka Peninsula | 55.98 ºN | 1956 | 5 |
| AGUNG | Indonesia, Lesser Sunda Islands | 8.34 ºS | 1963 | 5 |
| ST. HELENS | USA, Washington | 46.2 ºN | 1980 | 5 |
| EL CHICHON | Mexico | 17.36 ºN | 1982 | 5 |
| PINATUBO | Philippines , Luzon | 15.13 ºN | 1991 | 6 |
| HUDSON, CERRO | Chile | 45.90 ºS | 1991 | 5 |
| CHAITEN | Chile | 42.83 ºS | 2008 | 5 |
Not all volcanoes of a given Index have the same effect; those closest to the equator make the most difference to global temperatures, hence the inclusion of latitude in the above table. Figure 1 demonstrates the effects of volcanoes on observed temperatures and temperatures calculated by global climate models. The observed data is based on the HadCRUTv3 data set and the modelled data are based on the average 7 models we present elsewhere (http://www.climatedata.info/temperature/model-simulations/index.html). The data in the graph were calculated as the difference between the temperature in a particular year compared with the average temperature for the 5 preceding years.
http://www.climatedata.info/
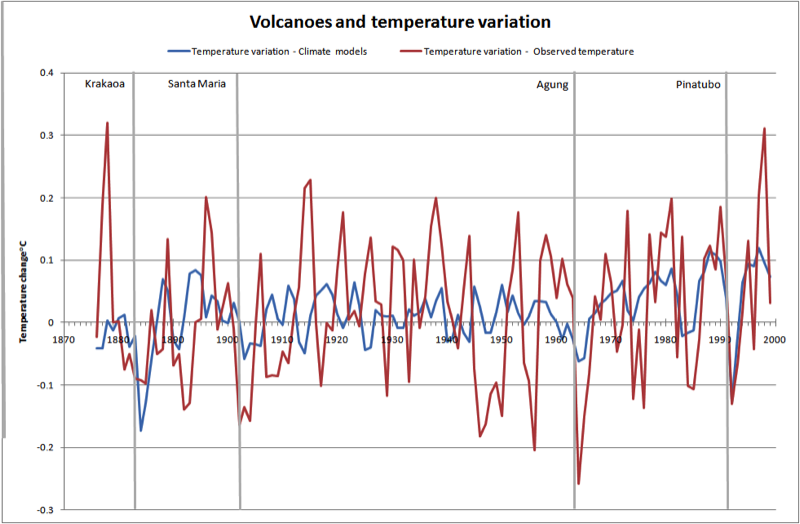
The first thing to notice is that all four volcanoes included above led to a reduction of temperature both in the observed and modelled data sets. There are however two differences between the observed and calculated temperatures. Firstly, the observed temperature shows much more short term variation than the calculated values, which may be an artefact of the of calculated figures being the average of several models. Secondly, all the largest falls in the calculated temperature are related to volcanoes but for the observed many large drops in temperature are due to natural causes.
In addition to particulate matter volcanoes emit large volumes of gas, mainly water vapour and CO2. Volcanoes emit about 130 million tonnes of CO2 a year. Submarine emissions add further 100 million tonnes. However human activity produces 30,000 million tonnes of CO2, 130 times as much.
In addition to particulate matter volcanoes emit large volumes of gas, mainly water vapour and CO2. Volcanoes emit about 130 million tonnes of CO2 a year. Submarine emissions add further 100 million tonnes. However human activity produces 30,000 million tonnes of CO2, 130 times as much.