MILANKOVITCH CYCLES
Milankovitch cycles describe the changes in the way the earth orbits the sun. These changes define the sequence of ice ages and warm periods.
Introduction to Milankovitch Cycles
The concept of the Milankovich cycles was developed in the 1930s by the Serbian mathematician Milutin Milankovitch. They take account of three variations in the orbit of the earth around the sun.- The earth’s orbit changes from being nearly circular to slightly elliptical (eccentricity). This cycle is affected by other planets in the solar system and has a period of around 100,000 years.
- The angle of tilt of the earth’s axis changes from 22.1° to 24.5° (obliquity). This cycle has a period of 41,000 years.
- The direction of the tilt of the axis changes (precession) on a cycle of 26,000 years.
http://www.climatedata.info/
Milankovitch and Temperature
Figure 2 shows the Milankovich cycles and temperature estimated from the Vostok ice core. In this case the timing of the temperature changes was “tuned” to the Milankovitch cycles; that is, to compensate for uncertainties in the depth/age relationship of the ice core, small adjustments were made to the timing of the temperature to agree with the cycles. As can be seen there is good agreement between the timing of the Milankovitch cycles and the timing of temperature changes. In general, though not always, there is agreement between the amplitude of radiation from Milankovitch cycles and the temperature changes.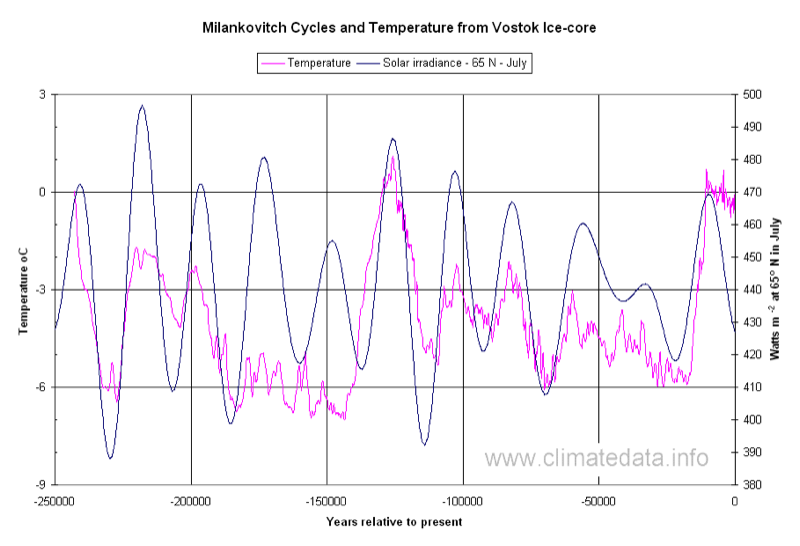
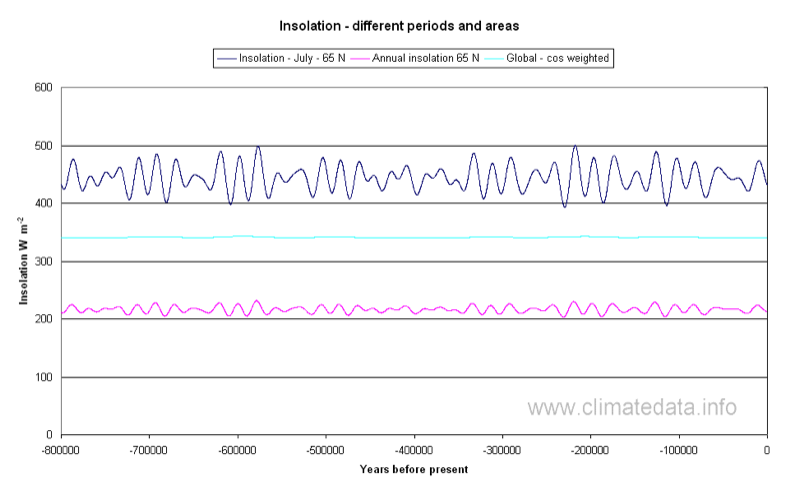
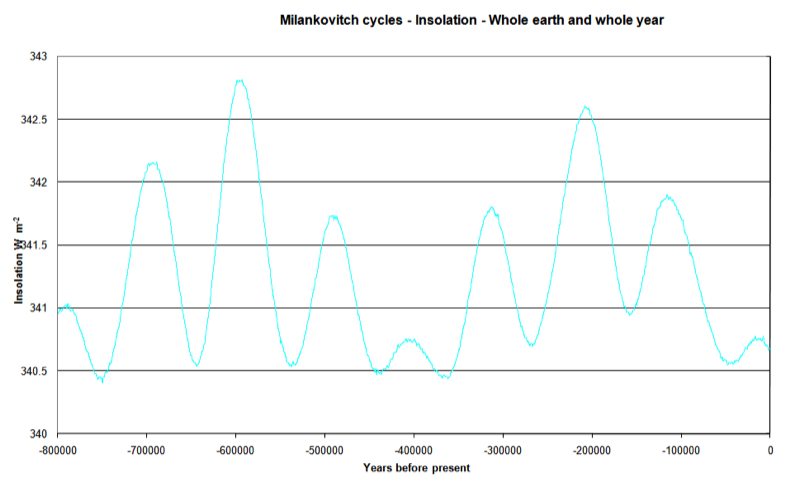
In this section, Figure 1 shows that global changes in radiance due to the Milankovitch cycles are proportionality smaller than the changes at 65 ºN in July. The figure of 0.7%, for global radiation change, given above, is in fact a bit misleading as it refers to the difference between the highest maximum and the lowest minimum in the last 800,000 years. Figure 3 shows only the whole year-whole earth variation in total solar radiance due to Milankovitch cycles. It can be seen that for many cycles the change between a maximum and a minimum is much less that 0.7 %. The last Milankovitch cycle, which had a minimum about 50,000 years ago and a maximum about 20,000 years ago is one of the most interesting. The minimum is 340.545 W m-2 and the maximum is 304.780 W m-2, a difference of 0.07% which is an order of magnitude less that the overall range. What makes this cycle so interesting is that while the change in global radiation was so small, the change at 65 ºN in July was enough to take us out of the last age into the current warm interglacial.
Possible Explanations of Milankovitch Effect
Whilst it is generally accepted that Milankovitch cycles explain the sequences of warm and ice ages there is no agreement on the mechanism by which this happens. One possible explanation might be that at these latitudes there is a higher proportion of land - which heats up more rapidly than sea - than elsewhere. Figure 4, prepared by digitising a Mollweide equal-area projection map of the earth, shows the percentage of land in the different latitude bands.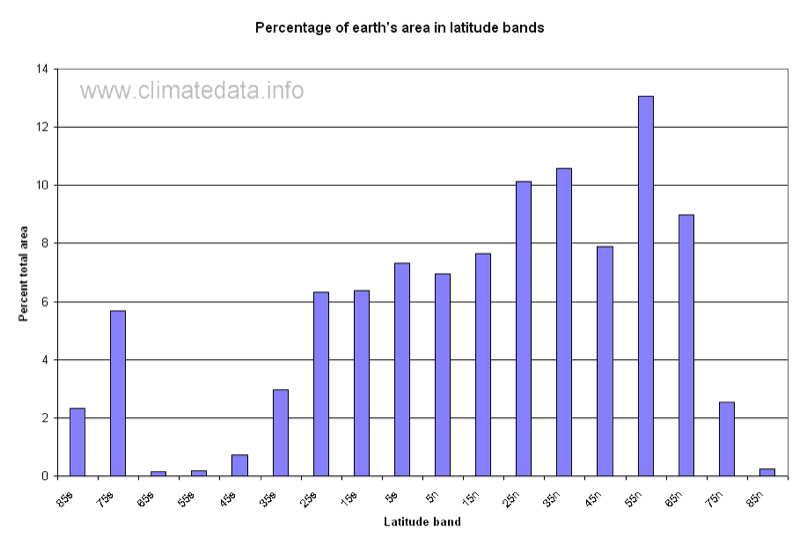
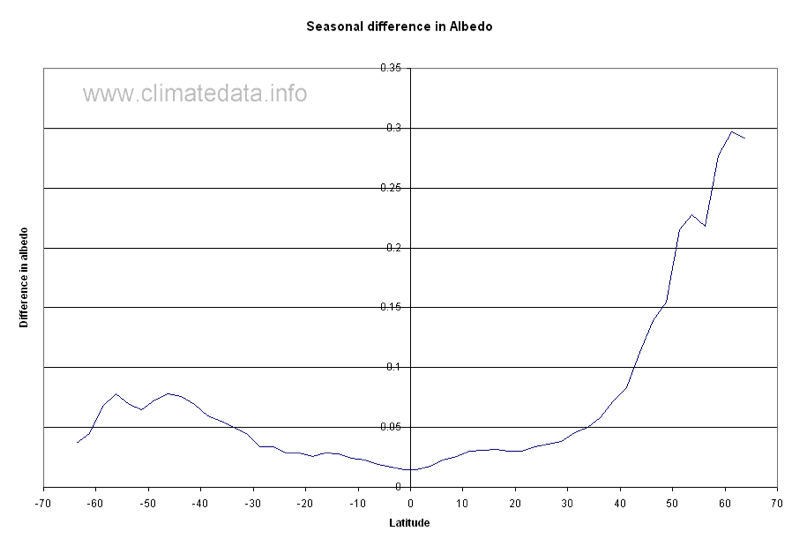
This is also the part of the earth where boreal (northern) forests predominate. Such forests of mainly pine tree, make up from 10% to 15% of the earth’s surface and have a wide difference in albedo (reflectance or incoming radiation). Figure 5 represents the difference in albedo between the maximum and minimum over a 4 year period. As can be seen the difference in albedo peaks toward 65°N. It is not possible to continue the graph beyond the limits shown as they are not visible to the satellite used for the measurement for the whole year.