OSCILLATIONS
The earth’s climate undergoes regular cyclical changes. Those related to changes in the orbit of the earth around the sun have a periodicity of tens of thousands of years. Those related to the seasons have an annual pattern. Superimposed on these are number of oscillation. These are less regular than the cycles mentioned above and have periods from a few months up to several decades. Their cause is not clearly understood but changes in one part of the world can have well defined effects on global weather patterns. The cycles are generally defined by changes in air pressure, sea temperature and wind direction over oceans.
The principal oscillations are:
The indicators of an El Niño are:
The principal oscillations are:
- El Niño/Southern Oscillation (ENSO) which is observed in the southern Pacific and has a periodicity of 3 to 8 years
- Pacific Decadal Oscillation (PDO) which is observed over the whole Pacific hand has a periodicity of two or three decades
- North Atlantic Oscillation (NAO) which is observed over the northern Atlantic Ocean and has a period of around one decade
El NIÑO/Southern Oscillation (ENSO)
This is the most important of the oscillations. The phrase El Niño means the boy child in Spanish and its use came about as it was first noticed by Peruvian fisherman when warmer than usual conditions were experienced at around Christmas . It has a counterpart called La Niña which means the girl child whose effects are the opposite of those of El Niño. Another oscillation was known as the “Southern Oscillation” as this affected the southern Pacific. It is now generally considered that these two are aspects of the same phenomena and are referred to by the single acronym ENSO.The indicators of an El Niño are:
- A rise in air pressure over the Indian Ocean (Darwin in Australia is used a reference meteorological station) coupled with a fall in pressure over the central and eastern Pacific (Tahiti is used a reference station)
- The westerly tropical trade winds weaken or reverse direction
- Warm, nutrient-poor, water reaches the west coast of South America and replaces the cold, nutrient-rich , waters of the Humboldt Current
- Sea level in the Western Pacific rises by around 0.5 m
| El Niño | La Niña | |
| South America | Wetter along the Pacific coast of South America | Drier in Southern South-America |
| North America | Colder, wetter, winters in the Southwest and milder in the Midwest and Canada | Colder winters in the Northwest and warmer winters in the Southwest |
| Australia | Drier in North Australia | Wetter in North and Northeast Australia |
| Africa | Wetter in the East and drier in the Centre and South | Drier in the East |
| Asia | Drier in Southeast Asia | Wetter during monsoon |
El Niño is a complex phenomenon and cannot easily be indexed by a single variable. One such measure, known as the Multivariate El Niño Index (MEI), is based on 6 variables: sea level pressure, zonal wind, meridional wind, sea surface temperature, surface air temperature and cloudiness (Figure 1).
http://www.climatedata.info/
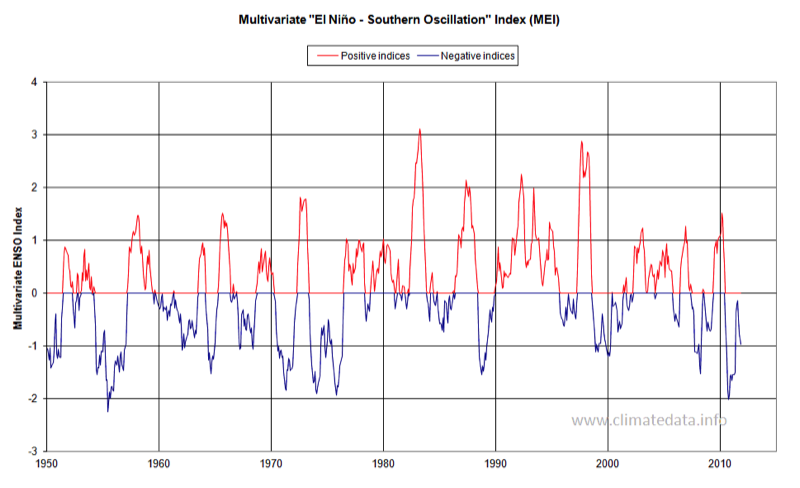
The highest values of the index were in 1983 and 1997. The 1997 maximum was followed by a very hot year – possibly the hottest recorded since records started in 1850. The 1983 maximum was also followed by a year in which there was a moderate temperature peak but the El Niño effect was possibly muted by the cooling effect of the El Chichon volcano in 1982.
This is shown more clearly in the Figure 2. We have calculated the average annual value of MEI on the same graph as the difference between the annual temperature and the 5-year mean temperature (including the years itself, the 2 years before and after) . The temperature is plotted like this to show years which are hotter or lower than would be expected from the long-term trend.
This is shown more clearly in the Figure 2. We have calculated the average annual value of MEI on the same graph as the difference between the annual temperature and the 5-year mean temperature (including the years itself, the 2 years before and after) . The temperature is plotted like this to show years which are hotter or lower than would be expected from the long-term trend.
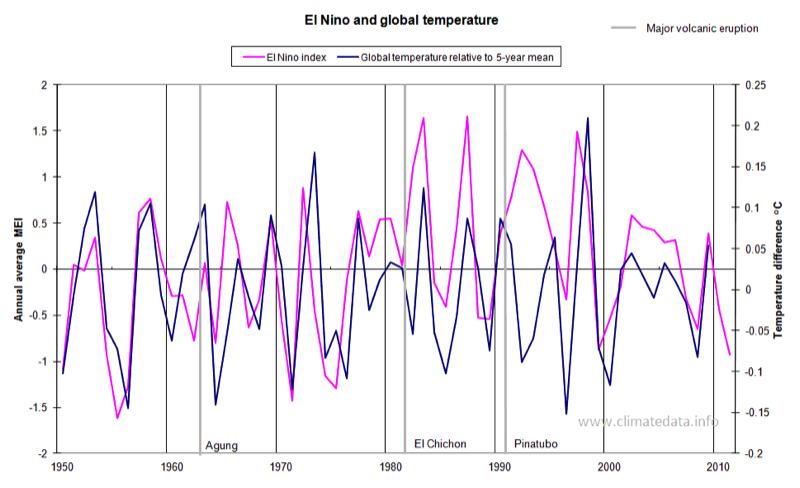
Toward the end of the 1990s and the start of this century we see what might be considered “classic” El Niño and temperature effects. In 1997 there was a high index and a year later a high temperature. The index then dropped and rose again as did the temperature, with a lag of a year. In the 1950s and 1970s there was similar agreement between the MEI and temperature. Figure 2 also shows the effects of volcanoes. The effect of the MEI peaks in mid-1960s, the early 1980s and early 1990s were negated by, respectively, the Agung, El Chichon and Pinatubo eruptions. A separate analysis shows that excluding 'volcano' years the values of r2 of temperature differences from the 5-year mean and the El Nino index is 0.4.
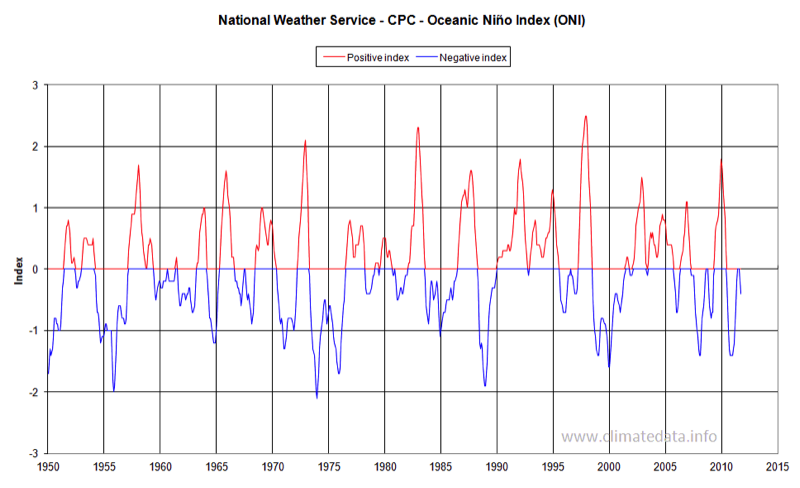
The US National Weather Service also maintains an El Niño based on sea surface temperatures, as shown in Figure 3.
The US National Weather Service also maintains an El Niño based on sea surface temperatures, as shown in Figure 3.
Pacific Decadal Oscillation
The Pacific Decadal Oscillation (PDO) has a similar geographical focus to that of the El Niño but whereas El Niño events last for a year or two those of the PDA last for one or two decades. Another difference is that its effects are most noticeable in North America and weakly in the tropics, the opposite of El Niño. The influence is seen most clearly in the productivity of fisheries. No effective method of predicting the cycles of the PDO have yet been developed but that fact that it leads to persistence in climate is itself an aid to forecasting. The index, shown in Figure 4, is based on sea surface temperatures.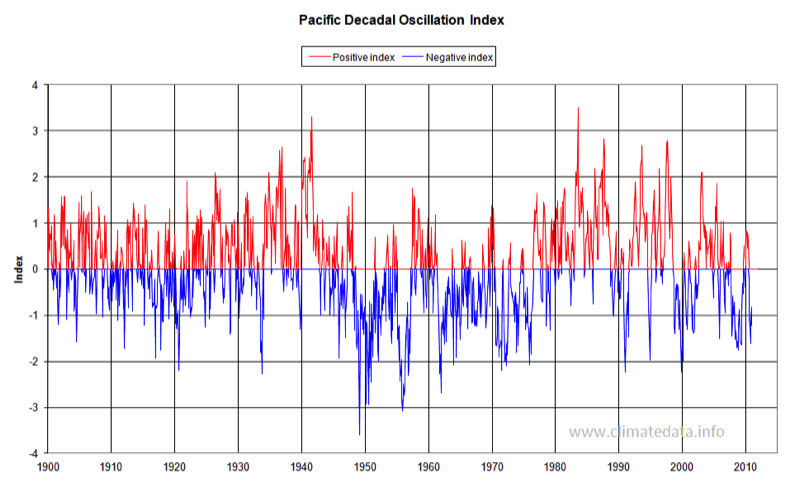
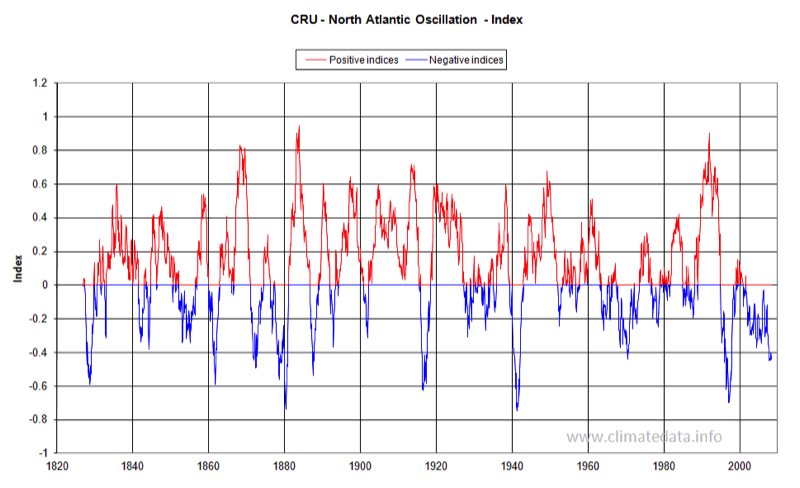
North Atlantic Oscillation (NAO)
A similar pattern of oscillation over a period of decades is observed in the North Atlantic. The data presented in Figure 5 is based on calculations from the Climate Research Unit at the University of east Anglia. It uses data from Iceland (Reykjavik), Gibraltar and Ponta Delgada (Azores). As with the PDO the fact that it provide some persistence in weather patterns is an aid to forecasting.