SNOW COVER
While measurements of parameters such as temperature give direct evidence of the nature and extent of climate change they are susceptible to what may be called ‘anthropogenic errors’, the principle one being the urban heat island effect. That is why phenomenological evidence is also frequently cited, a well known example being the extent of Arctic ice.
Here we give a different, less familiar metric, northern hemisphere snow cover. This, in a sense, is the complement of the Arctic Ice extent as it refers only to snow which has fallen on land. The data were originally collected for meteorological purposes not for climate analysis and have been carefully reworked by the Rutgers University. They found a few errors; some mistaken land/sea attributions for example, but the corrections were not major.
Here we give a different, less familiar metric, northern hemisphere snow cover. This, in a sense, is the complement of the Arctic Ice extent as it refers only to snow which has fallen on land. The data were originally collected for meteorological purposes not for climate analysis and have been carefully reworked by the Rutgers University. They found a few errors; some mistaken land/sea attributions for example, but the corrections were not major.
http://www.climatedata.info/
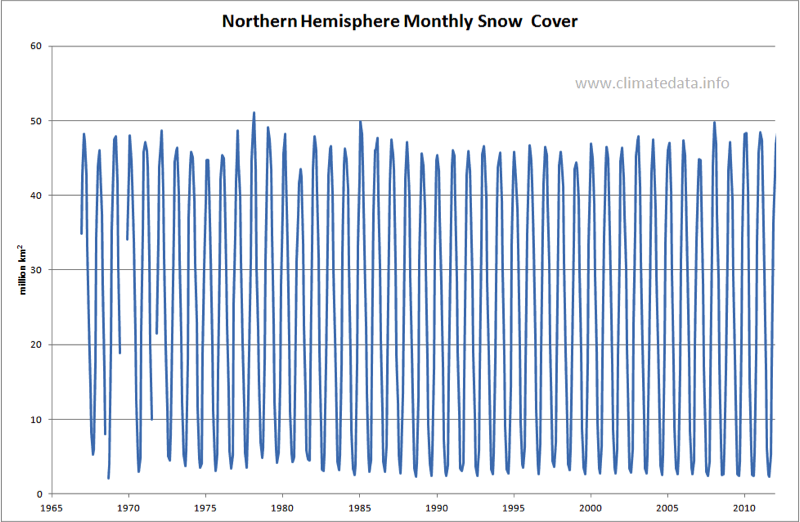
The monthly plot of snow cover presented in Figure 1 show considerable seasonal variation which, together with some missing months of data in the early years, masks any long-term trend.
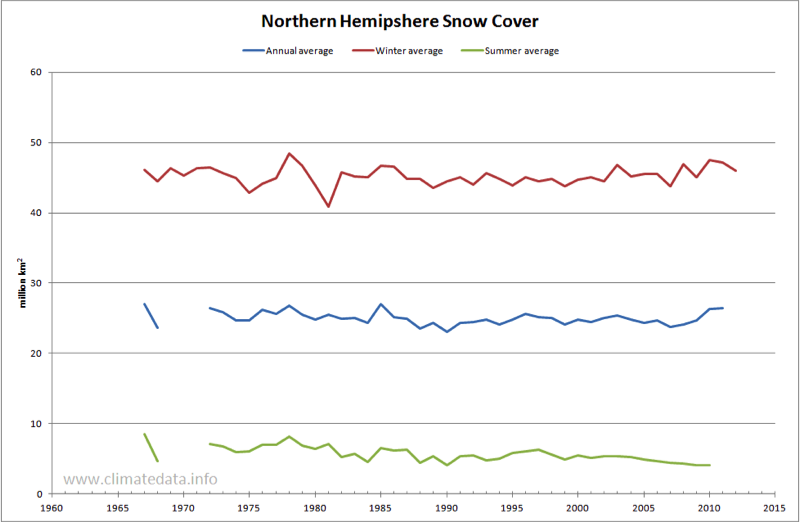
The following plot (Figure 2) shows the annual average cover (for years with at least 10 months of data), the summer average (for years with at least 3 months data in the period June to September) and the winter average (December (preceding year), January and February, no missing data). This data shows that while there has been a trend toward reducing summer snow cover, the winter area varies from year to year but has less of a trend. There are signs of a recovery in recent years and the winter snow cover in 2009/2010 was the highest since 1978 and the second highest in the record.
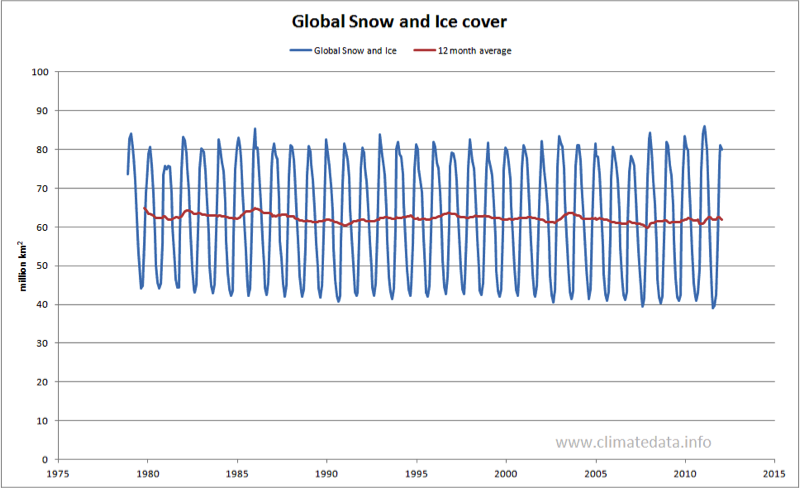
This data also enables us to present another useful metric: the total snow and ice cover. This is made up of the sum of: Arctic sea-ice extent, Antarctic sea-ice extent and Northern hemisphere snow cover over land. The only value missing from the above is Southern hemisphere snow cover over land which is relatively small. For example the maximum extent in South America is only 0.3 million km2 so variations would not affect the total significantly. As can be seen in Figure 3, the global snow and ice cover fluctuates between 30 and 70 million km2 with the minimum falling during the Northern hemisphere summer. Over the period of the record (1979 to 2010) the trend line indicates a reduction of about 1.5 million km2, 3% of the long-term average.