TROPICAL CYCLONES
The frequency and strength of hurricanes and other tropical storms is regarded as an indicator of climate change.
When storms reach land, or cold water, they lose energy as the conditions necessary to reinforce them are no longer present.
In the 19th century there was no instrumental measurement of wind speed and even for the early years of the 20th century the instruments were not always accurate or reliable (they often broke during the most severe storms). Whilst satellites are now able to track tropical storms information on early events either came from those which made landfall or from post-event analysis of ships logs. It is possible that some 19th century events were not recorded at all Considerable effort has been made to produce accurate estimates of the energy of early hurricanes using information such as Beaufort Scale reports or correlation with other measured parameters such as atmospheric pressure. It should also be noted that an annual index may be made up of many events not all of which would have been at the high end of the scale when measurement was most difficult.
Despite these potential limitations we believe that the Accumulated Cyclone Energy index for the period 1851 onward for the Atlantic has a reasonable validity.
Introduction to Cyclonic Storms
Intense cyclonic storms, or tropical cyclones, are experienced in many part of the world. If they occur in the Atlantic or Caribbean they are known as hurricanes, in the Pacific or China Sea as Typhoons and off the coast of Australia as Cyclones. Tropical storms are caused by warm moist air over seas rising. As the air rises it draws in more warm air which feeds the storm. As the hot air rises it also cools and condenses. When it condenses it gives up the latent heat of vaporisation which gives more energy to the storm.When storms reach land, or cold water, they lose energy as the conditions necessary to reinforce them are no longer present.
Accumulated Cyclone Energy
The energy of a cyclone is proportional to the mass of the air and its velocity squared. An index of the cyclone energy, known as the Accumulated Cyclone Energy has been developed. It is based on the sum of squares of the maximum 1-minute, 10 metre, velocity measured at 6 hourly intervals. The velocity is in knots (1 knot is equivalent to 1.8 km/h). This index can be used to assess the severity of a single hurricane or the severity of a hurricane season. It can be expressed as: ACE = ∑ V2/10000, where V is the maximum velocity in knots during 1 minute measured at 10m above sea level. The factor of 10000 is applied to keep the numbers in a manageable range.In the 19th century there was no instrumental measurement of wind speed and even for the early years of the 20th century the instruments were not always accurate or reliable (they often broke during the most severe storms). Whilst satellites are now able to track tropical storms information on early events either came from those which made landfall or from post-event analysis of ships logs. It is possible that some 19th century events were not recorded at all Considerable effort has been made to produce accurate estimates of the energy of early hurricanes using information such as Beaufort Scale reports or correlation with other measured parameters such as atmospheric pressure. It should also be noted that an annual index may be made up of many events not all of which would have been at the high end of the scale when measurement was most difficult.
Despite these potential limitations we believe that the Accumulated Cyclone Energy index for the period 1851 onward for the Atlantic has a reasonable validity.
http://www.climatedata.info/
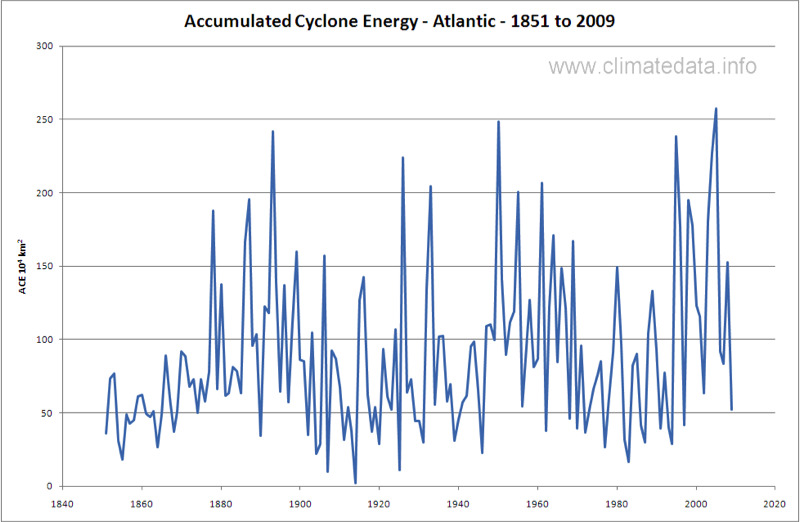
Figure 1 shows that the energy of the storms went through a number of rising and falling episodes. There was a rising trend from 1851 to 1893 and a falling trend to 1914. The energy index then rose to 1950 and fell to 1980. It then rose again reaching a maximum in 2005. What is interesting in these figures is that the periods of rising and falling tropical storm energy correspond, with a lag of a few years, to periods when northern hemisphere temperatures were rising and falling. The periods of rising and falling temperatures were superimposed on a general increase in temperature and there is a small general increase in cyclone energy. On the other hand, while the temperature peaks in 1893 and 1950 were almost 0.5 °C lower than the 2005 peak the equivalent energy peaks were very similar.
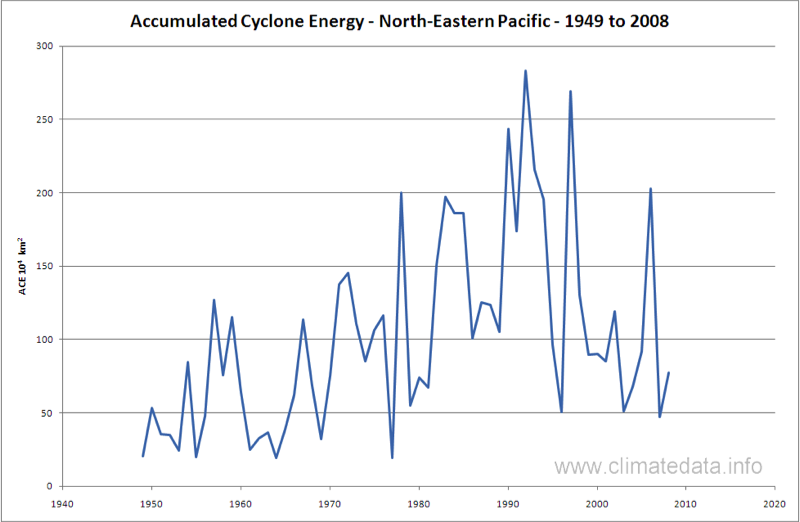
Similar data are shown in Figure 2 for the north-eastern Pacific but for a shorter period. These figures also show a relatively stable period in the mid-20th century with rising cyclone energy levels in last quarter of the century. There is some evidence of reciprocity with Pacific cyclone energy being higher when Atlantic energy is lower.
The Saffir-Simpson Scale
When Atlantic hurricanes make landfall it is on the East coast of the USA where they have been recorded and classified for a long time.Hurricanes are classified according to the Saffir-Simpson Scale (SSS):
| Type | Category | Pressure (mb) | Winds (knots) | Winds (mph) | Surge (ft) |
| Depression | TD | ----- | < 34 | < 39 | |
| Tropical Storm | TS | ----- | 34-63 | 39-73 | |
| Hurricane | 1 | > 980 | 64-82 | 74-95 | 4-5 |
| Hurricane | 2 | 965-980 | 83-95 | 96-110 | 6-8 |
| Hurricane | 3 | 945-965 | 96-112 | 111-130 | 9-12 |
| Hurricane | 4 | 920-945 | 113-135 | 131-155 | 13-18 |
| Hurricane | 5 | < 920 | >135 | >155 | >18 |
TD = tropical depression; TS = Tropical storm
Figure 3 shows the number of hurricane sinces 1850. This graph shows similar periods of rising and falling hurricane intensity to the above graphs based on energy. Where it differs is in suggesting that there has been no overall increase in storm intensity.
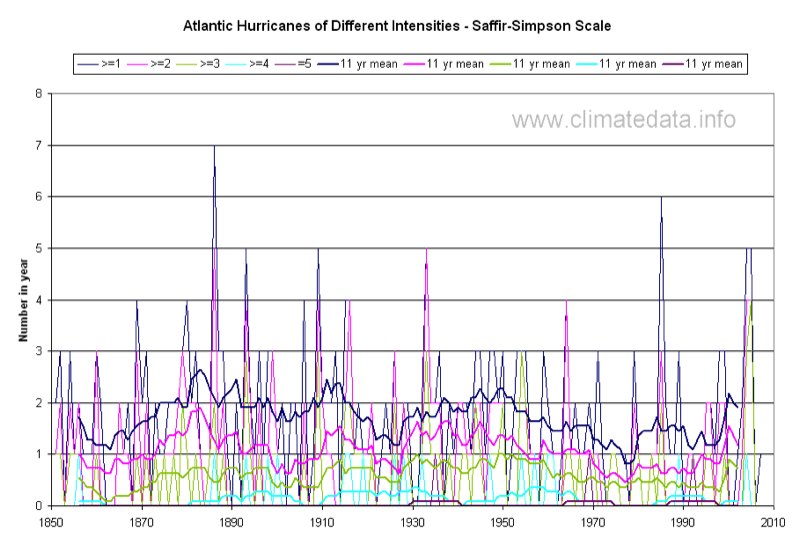
By including only hurricanes which made landfall it avoids the bias from including hurricanes only traceable in recent years from planes or satellites. There are some concerns about the accuracy of wind speed measurements for earlier years but the other elements of the index, pressure and surge, are less subject to error.