SEA ICE
It is widely accepted that global warming will manifest itself most in the polar regions. Sea ice is therefore an effective indicator of the climate change. In this section we provide information on the measurement of sea ice, the changes in area and also the measured thickness of sea ice.
- Measurement & Change in Area
- Changes in Thickness
Tab 1
Since late in 1978 measurements of sea ice extent have been available from satellite sensors. The measurements have been made by a series of different satellites. The National Sea Ice Center of the University of Colorado maintains files of ice extent and concentration. The area of sea ice varies throughout the year, with of course, the Arctic and Antarctic being out of phase. There is an important difference between the two: Arctic sea ice is surrounded by land whereas the Antarctic is land surrounded by ice.
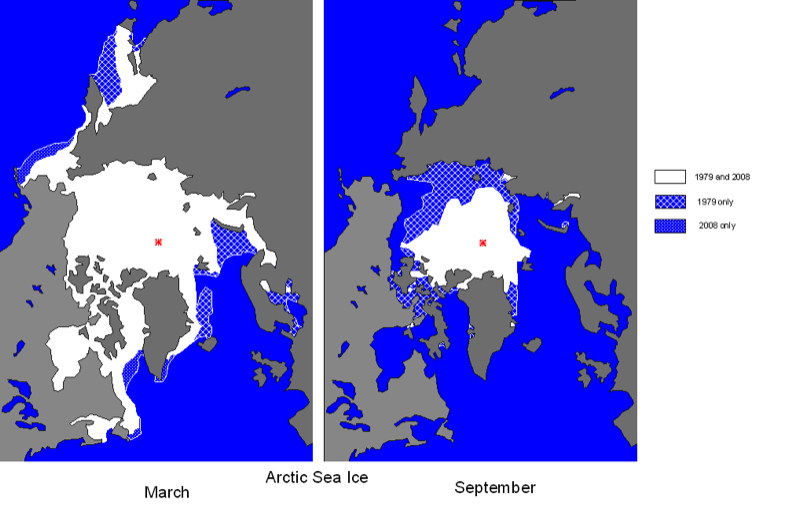
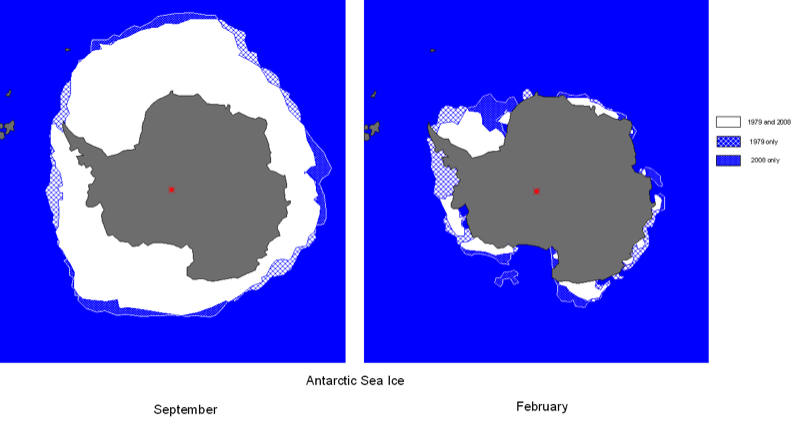
Figure 1 and Figure 2 show the changes in summer and winter sea ice for the Arctic and Antarctic, respectively, for the years 1979, the first year with data, and 2008, the most recent complete year. As can be seen there are big differences in summer and winter ice and the main change has been in the summer sea ice in the Arctic.
Figure 1 and Figure 2 show the changes in summer and winter sea ice for the Arctic and Antarctic, respectively, for the years 1979, the first year with data, and 2008, the most recent complete year. As can be seen there are big differences in summer and winter ice and the main change has been in the summer sea ice in the Arctic.
http://www.climatedata.info/
Change in Sea Ice Area
Figure 3 shows the change in area of sea ice in the northern and southern polar regions. This suggests that whilst the area of sea ice has declined in the Arctic it has tended to increase in the Antarctic.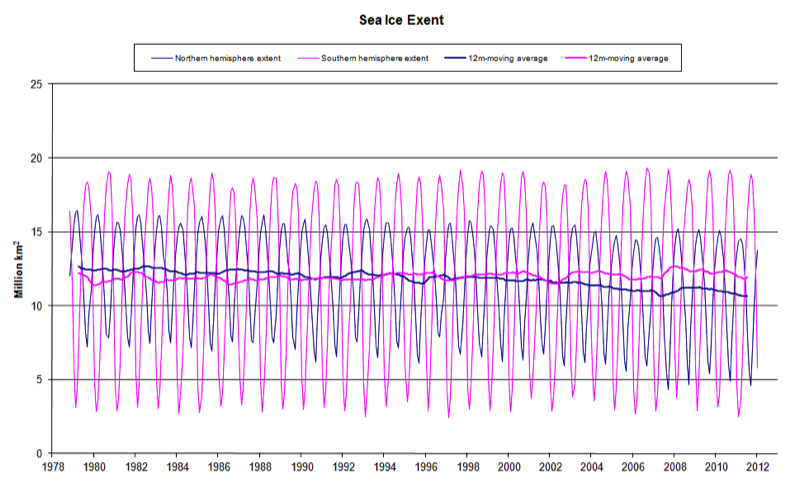
Figure 4 shows the seasonal sea ice for the Arctic only from 1870 to 2008. The plots show the annual average and the maximum and minimum seasonal extent. This shows that arctic sea ice was more or less constant until the latter half of the 20th century.
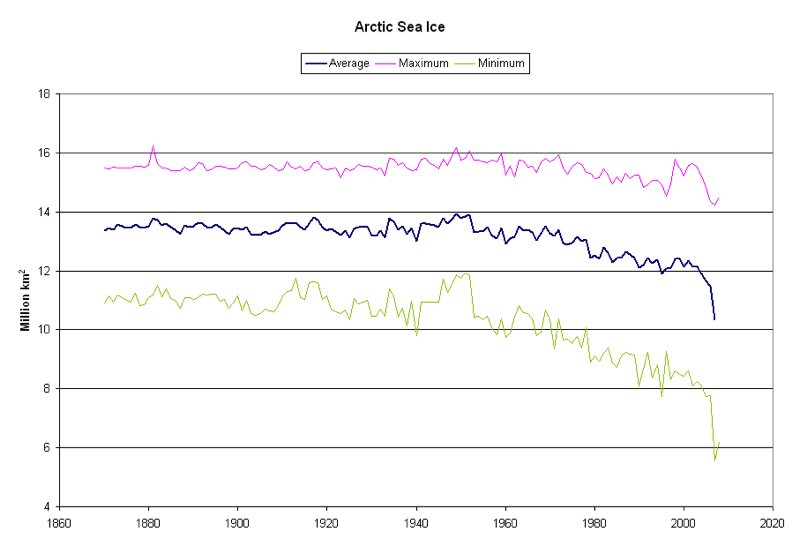
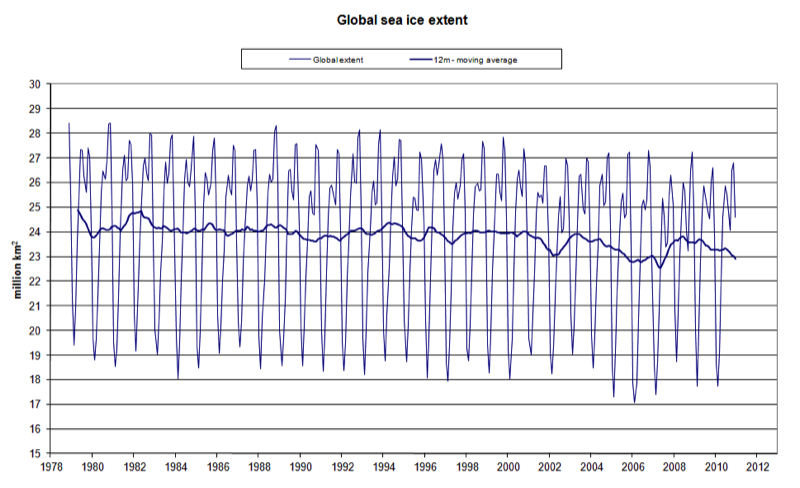
Figure 5 shows the total sea ice for the Arctic and Antarctic. This shows that overall there has been a decline in sea ice and that the increase in the southern hemisphere is less than the decline in the northern hemisphere. This represents a decline of about 32,000 km2/year. Allowing for permanent land ice this represents an annual loss of 0.08% of polar ice.
Tab 2
The Polar Ice Prediction System (PIPS 2.0) is the operational model run by the Naval Oceanographic Office (NAVO) for sea ice forecasting. The PIPS 2.0 coupled ice-ocean model forecasts ice conditions from the North Pole south to 30°N latitude, where daily values of ice thickness have been provided since October 1998. The forecasts are initialised using buoys and ice concentration data from a Special Sensor Microwave Image (SSM/I). The forecast values of ice thickness use weather forecasts, with the results available as GIF images. A typical one is provided in Figure 1. The thickness of the ice is given by a colour scale which goes from 0.5 to 5.0 m in steps on 0.25 m, though in fact there appear to be no pixels in the 0.5 to 0.75 m range.
To derive areas and volumes of ice, the graphic images were downloaded and analysed by counting the numbers of pixels of each colour provided. The projection used is not an equal area projection and as such, the areas derived are approximate (hence the use of the ‘nominal’ on the following charts). They were based pro-rata on a scanned image of Greenland. However, it should also be noted that occasionally there were anomalous values, for example for a few days the Caspian and Aral seas were included as ice cover.
To derive areas and volumes of ice, the graphic images were downloaded and analysed by counting the numbers of pixels of each colour provided. The projection used is not an equal area projection and as such, the areas derived are approximate (hence the use of the ‘nominal’ on the following charts). They were based pro-rata on a scanned image of Greenland. However, it should also be noted that occasionally there were anomalous values, for example for a few days the Caspian and Aral seas were included as ice cover.
http://www.climatedata.info/
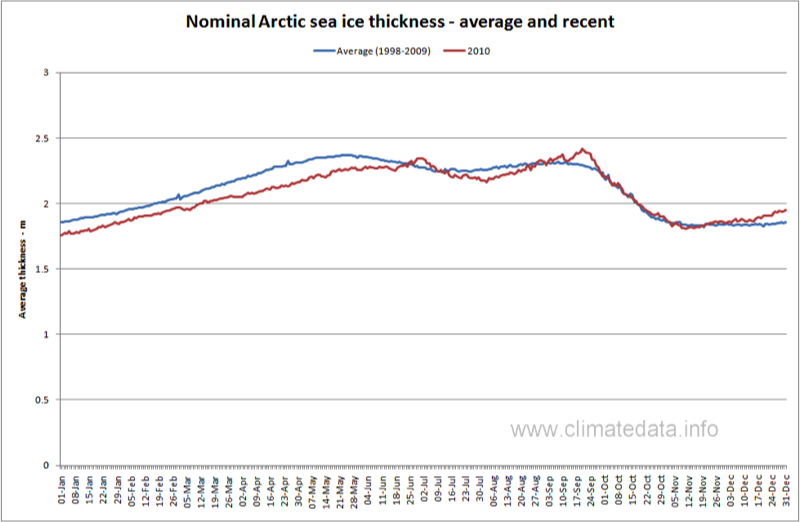
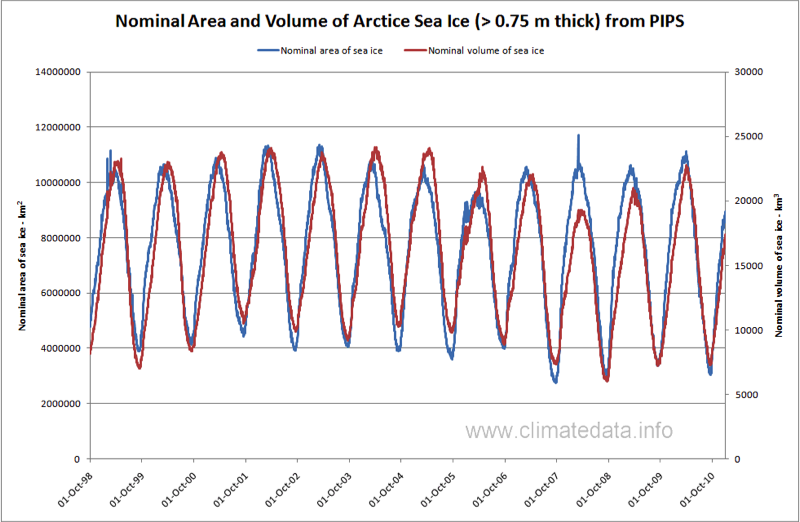
Figure 2 shows the area and volume of sea ice from October 1998 to December 2010. These figures only apply for ice greater than 0.75 m thick and consequently the areas are less than those shown elsewhere on this site. None-the-less they demonstrate a similar pattern. In general the volume and area show maxima and minima at similar times but after the low summer minimum of 2007 the ice area recovered well in 2008 but the volume did not. This can be seen more clearly on the chart on ice thickness in Figure 3, which shows that minimum ice thickness was less in 2008 than in 2007, giving some support to those who said the ice that year was “rotten”.
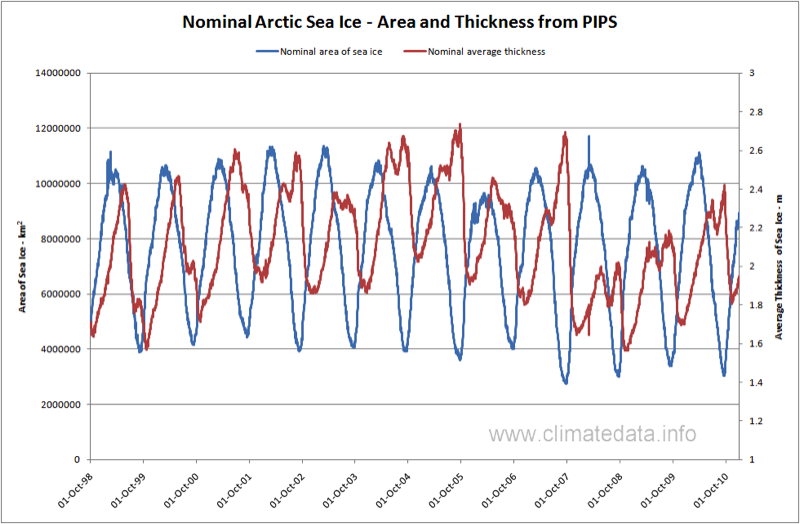
It is interesting to note that the ice thickness is bi-modal; one maximum occurs in May, when the ice area has just passed its maximum, and the second in September near to the point when it is at its minimum. This can be seen more clearly in Figure 4, which compares average thickness with current ice thickness. Figure 4 confirms that at the start of 2010 the ice thickness was less than the average for the preceding 10 years but as of December 2010 it had recovered to its average value.