SUNSPOTS
Sunspots have been observed by astronomers for 4 centuries. Many people suspect that the cyclical variation in the number of sunspots has an influence on climate but no mechanism for this link has been incontrovertibly demonstrated.
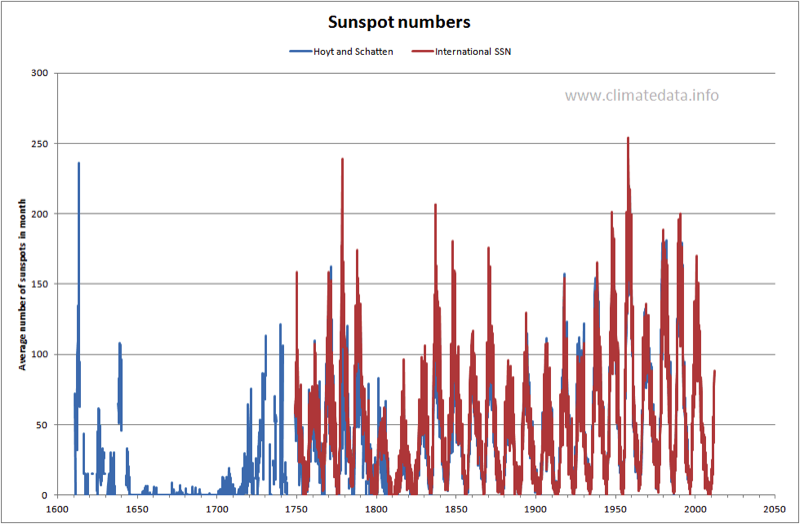
Two things are very obvious from this chart. Firstly that sunspot numbers are cyclical. The time between peaks averages about 11 years but is not constant. Secondly there was a period in the late 17th century when the number of sunspots was very low. This period coincided with a series of very cold years in Europe, Greenland and North America. This period is named the Maunder Minimum after the British astronomer who wrote about it though it had first been noticed by Gustav Spörer, a German astronomer.
Introduction to Sunspots
There are some early historical reports of naked-eye observations of sunspots but their study really began in the 17th century after the invention of the telescope. Sunspots vary in their size and simply counting the number of spots is a bit inconsistent. Since the middle of the 18th century sufficient data has been collected to produce systematic records of sunspots. Figure 1 shows the estimate of sunspots since 1600 prepared by Hoyt and Schatten.Two things are very obvious from this chart. Firstly that sunspot numbers are cyclical. The time between peaks averages about 11 years but is not constant. Secondly there was a period in the late 17th century when the number of sunspots was very low. This period coincided with a series of very cold years in Europe, Greenland and North America. This period is named the Maunder Minimum after the British astronomer who wrote about it though it had first been noticed by Gustav Spörer, a German astronomer.
http://www.climatedata.info/
Sunspot Cycles
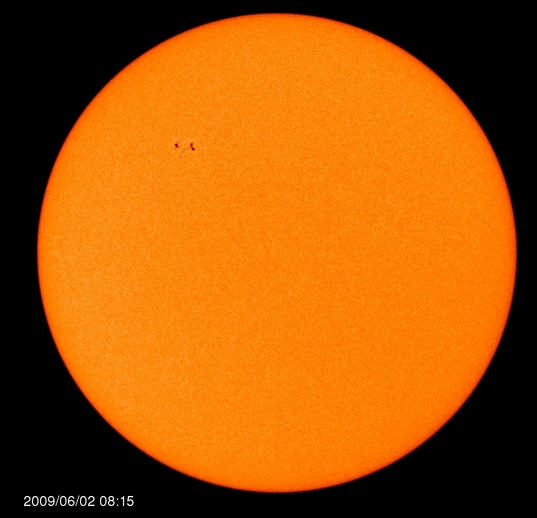
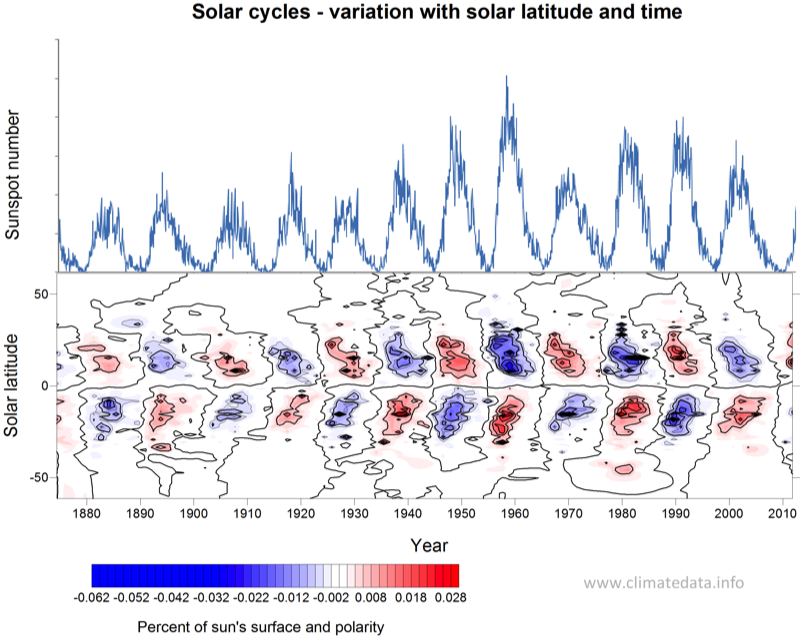
Whilst people speak loosely about an 11-year sunspot cycle it is in fact more complicated then that. Firstly the cycles are in pairs with the magnetic polarity reversed. Secondly the location of the sunspots follows are particular pattern. After a minimum the first sunspots of the new cycle appear some distance away from the sun’s equator. As the cycle progresses they more close to the equator. This is shown in Figure 2, sometimes called a “butterfly diagram”. The graph also shows sunspot numbers. As can be seen at a solar minimum there are few sunspots, as the cycle progress more and more of the sunspots are nearer to the equator. This continues even after the solar maximum. The current sunspot cycle started in 1996 and peaked in 2001. It will be possible to know when the next cycle starts if sunspots start appearing away from the equator. This is shown in the two pictures of the sun below. The first on the left was taken on 27 March 2008. In this case the sunspots are near to the sun’s equator and are clearly part of the previous cycle. The second, on the right, was taken on 6 February 2009. In this case, the sun spots are some distance from the equator and are therefore harbingers of a new cycle.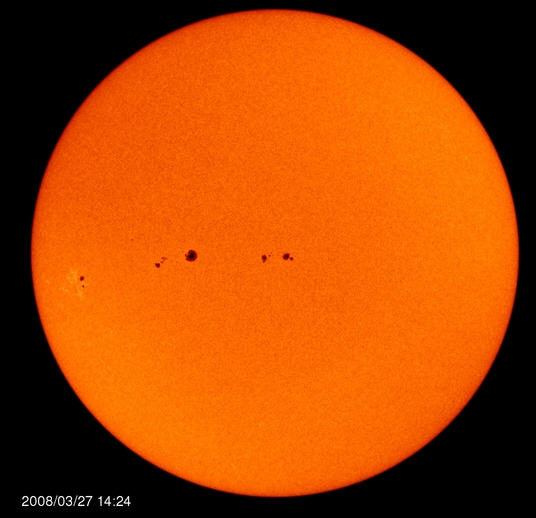
Sunspots and Solar Irradiance
In terms of total solar irradiance (TSI) the change, at a global level, is very small. Figure 3 shows the TSI for the period 1978 to 2008. As can be seen, there is general but not exact agreement between the solar irradiance and the sunspot numbers. The solar irradiance figures have been adjusted to give monthly values. They were in fact based on data from a series of satellites which all gave accurate relative values of irradiance but which differed slightly in absolute values. They have also been adjusted for the eccentricity of the earth’s orbit which would otherwise impose an annual cyclical variation in the values. The amplitude of the irradiance is about 0.24%. In this case the sunspot numbers are those calculated by the Royal Belgian Meteorological Service. Although the amplitude of solar irradiance in the visible spectrum is small, in the ultra-violet spectrum it is larger, around 6%.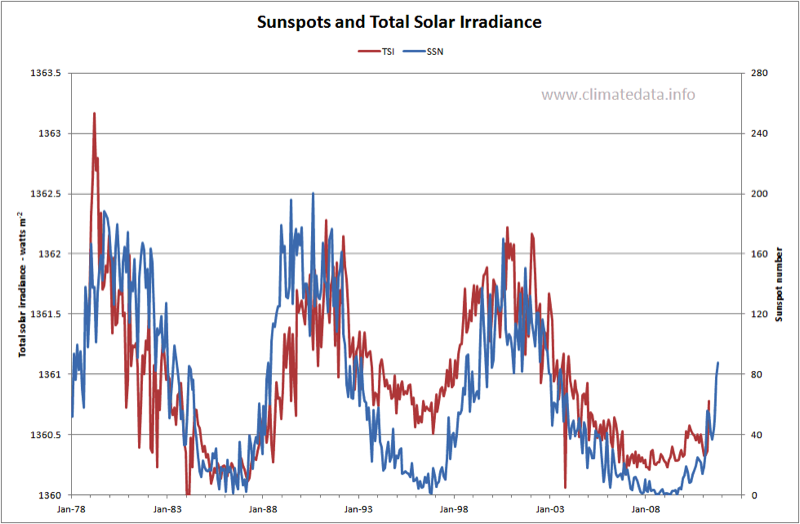
Sunspots and Solar Radio Flux
In the 10.7 cm spectrum the amplitude of solar radio flux is larger still (Figure 4).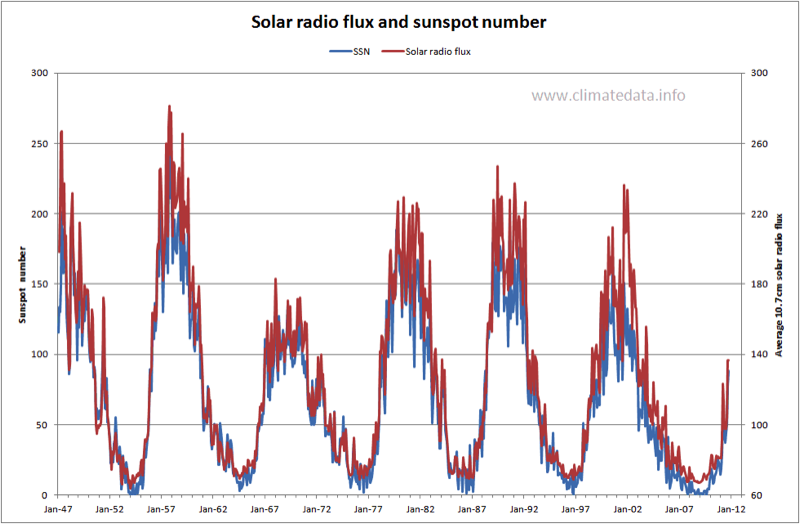
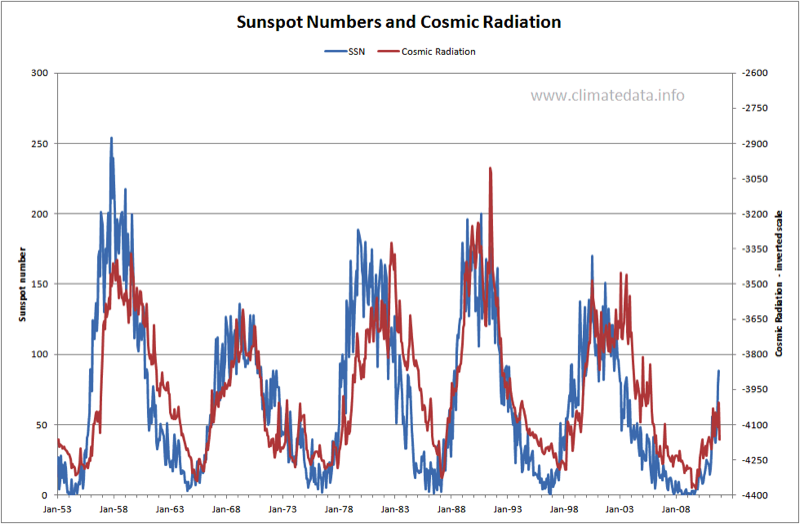
Sunspots and Cosmic Radiation
One of the possible explanations for a link between sunspots and weather is via cosmic rays. It is accepted that cosmic rays play a part in cloud formation by encouraging the nucleation of water droplets. It is also accepted that there is a negative correlation between sunspots and cosmic rays. Figure 5 demonstrates this link.