TREE RINGS
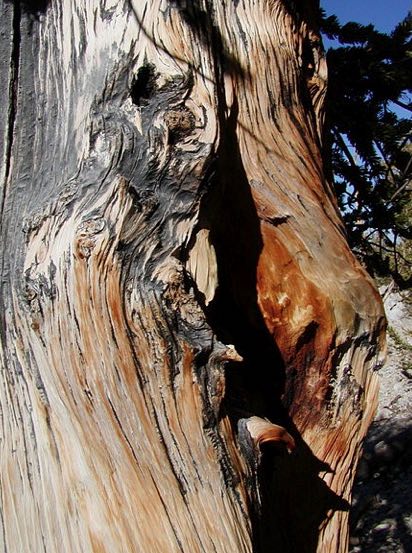
The width of tree rings varies with, among other things, temperature. They can be used to estimate temperature for times before thermometers were in widespread use. When cross sections are taken of trees there is a pattern of annular rings. The width of these rings is, in part, a function of temperature.
Other things which can affect ring width are:
Even in well chosen sites it has to be recognised that ring width is not a uniform function of temperature but is biased toward the temperatures during the growing period. This is sometimes dealt with by analysing early and late growth separately.
It is not necessary to fell the tree first – normally samples are taken by boring into the tree with a hollow bit. Dozens of samples are normally taken from a group of trees.
Other things which can affect ring width are:
- The age of the tree. The rate of growth varies through the life of the tree.
- Weather. In addition to temperature, ring growth is also affected by precipitation and to a lesser extent by wind speed and sunshine.
- Previous years. If a tree has grown vigorously in one year it is likely to grow vigorously in following years and vice versa.
- Atmosphere. Carbon dioxide is necessary to growth and increased levels of carbon dioxide can lead to enhanced growth.
- Competition. Other trees nearby or other plants can rob a particular tree of nutrients or light.
- Parasites. Infestation by insects or fungi can slow the growth of the tree.
Even in well chosen sites it has to be recognised that ring width is not a uniform function of temperature but is biased toward the temperatures during the growing period. This is sometimes dealt with by analysing early and late growth separately.
It is not necessary to fell the tree first – normally samples are taken by boring into the tree with a hollow bit. Dozens of samples are normally taken from a group of trees.
http://www.climatedata.info/
Tree Rings Processing
For most trees the rate of growth declines with time as the tree becomes older. If no allowance was made for this it would appear the temperatures over the life of the tree were in decline. To allow for this the data are processed in 4 stages:- The raw data are normalised. That is the data are expressed as the ratio between the growth in one year and the average for the whole period. The normalised annual growths of all the samples are averaged to give the basic RAW data set.
- A curve is then fitted through this data to represent the trend in growth rate and the data are expressed as the difference between the trend line and growth rate. This is referred to as the standard (STD) chronology.
- The next stage is adjust the data set to compensate for serial correlation in the tree rings (this is the tendency mentioned in point 3 above for growth in one year to be in part a reflection of growth in preceding years.) This is referred to as the residual (RES) chronology.
- The final version adds pooled persistence to the data set. This is known as the ARS data set.
Figure 1 shows the four data sets for a tree ring in Russia. As can be seen in the raw data there is indeed a tendency for ring width to decline (blue line). Since this downward trend was interrupted by the increase in growth rate from around 1860, this shows up in the final sequence (turquoise) as a dip near 1860 followed by a rapid increase.
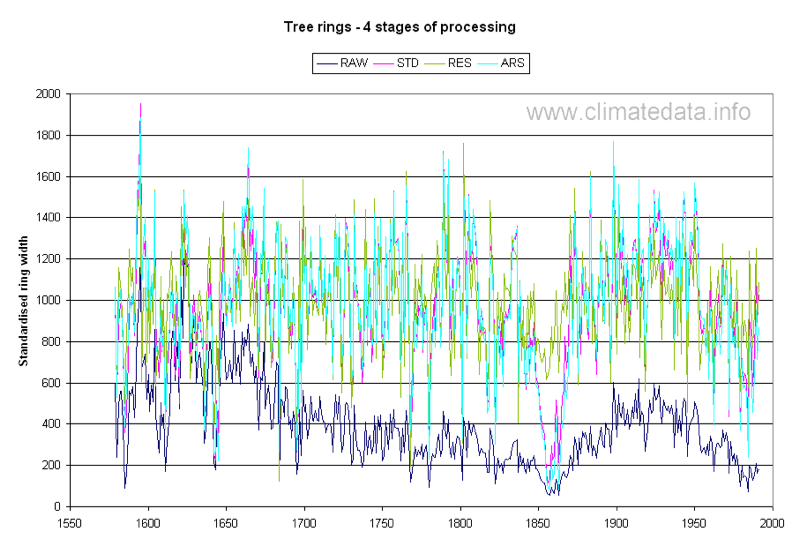
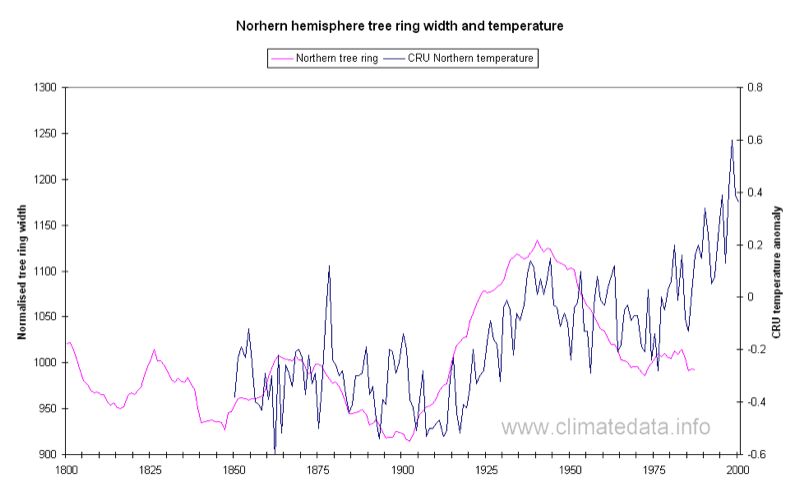
Figure 2 shows tree ring widths averaged from a number of sites in both the northern and southern hemispheres. Whilst for much of the time there is some synchronicity between the northern and southern ring widths there are also times when there is divergence between the two records. This includes a period of a few decades at the end of the 17th century when temperatures in the northern hemisphere were generally cold. What is important however is not the agreement between tree rings but the accuracy with which they can be used to estimate temperatures. It is generally accepted that the temperature data set produced by the Climate Research Unit of the University of East Anglia is an accurate representation of temperature from 1850 to the present. We have therefore compared the tree ring widths with the temperature record.
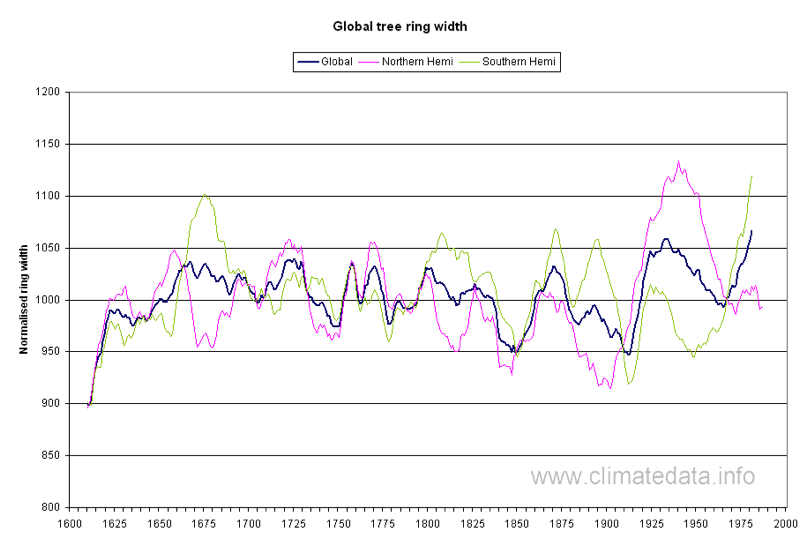
Figure 3 shows the effect of global temperatures on tree rings widths. As can be seen below there is reasonable agreement between the rate of growth and the temperature record. There is one interesting feature, which may be an artefact of the method of processing; the rate of growth of tree rings appears to precede the increase in temperature.
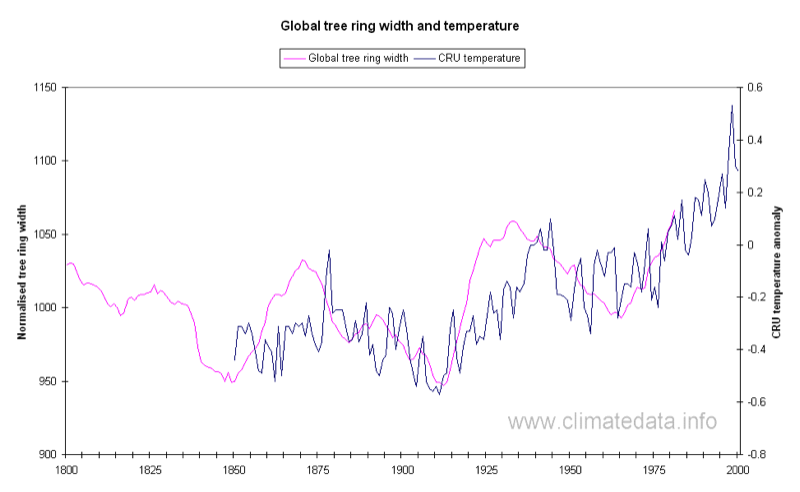
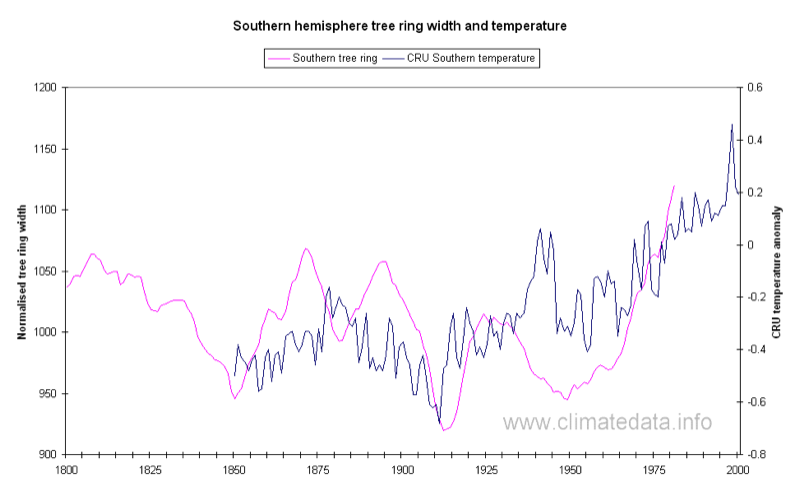
Figure 4 and Figure 5 show data for the Northern and Southern hemispheres, which show a general agreement on the pattern of rising and falling temperatures. Again the agreement is generally good except for the fact the observed temperature record shows an increase around 1940 not noticeable in the tree ring record.
Possible Pitfalls of Tree Rings as a Proxy
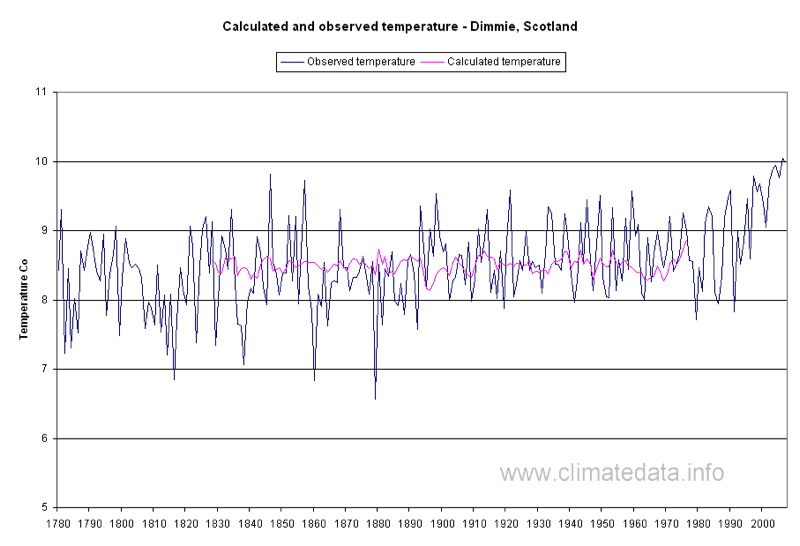
One way in which the presentation of data can be misleading is to combine data derived from a proxy source with observed data. In Figure 6 we show data for Dimmie in Scotland. This site is near to Edinburgh which has a two-century-long temperature record. The graph has calculated data up 1975 and observed data (plotted as 5-year moving average) from then onward. This appears to show little variation in temperature until the end of the 20th century: the classic “hockey stick” shape. Figure 7 shows the same data but with the observed data for the whole period superimposed on the calculated data. As can be seen, the calculated data has much less variance than the observed data, though still with an increase toward the end. This demonstrates a principle we have adhered to throughout this site: wherever possible we have presented all the data and where we have used data from different sources they are shown differently. In some cases, for example in comparing records of very different lengths, we have not plotted the whole record but in most cases the all the files we have created are available as separate downloads.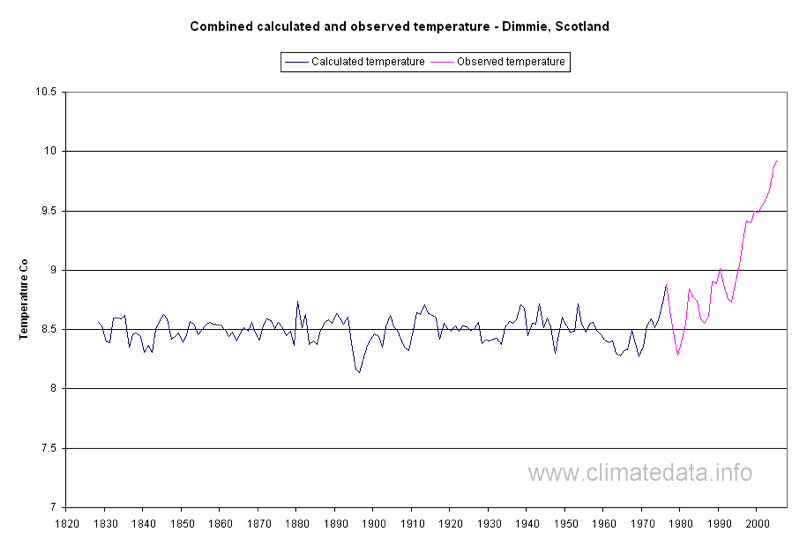
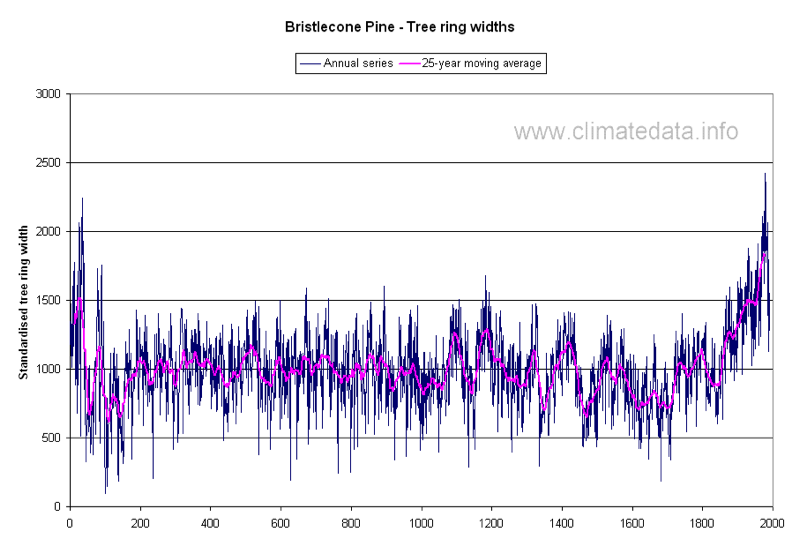
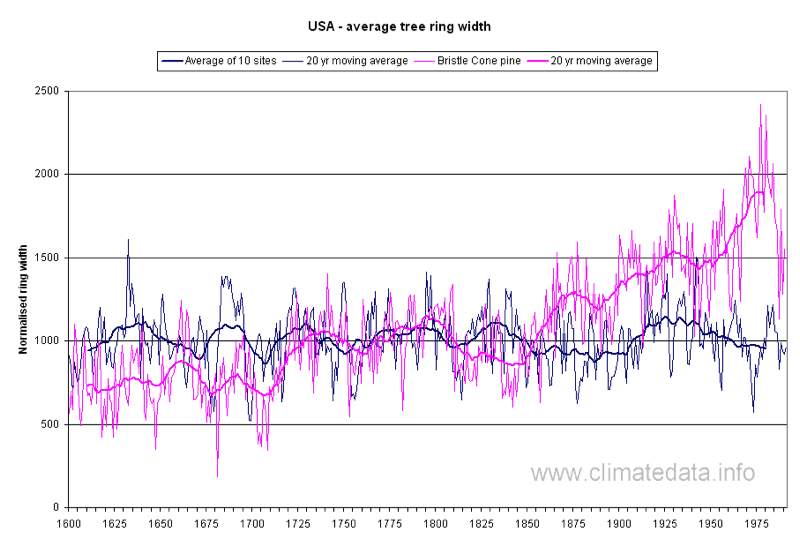
The final two graphs (Figure 8 and Figure 9) are for Bristlecone Pines from the USA. This record is very long – 2000 years – and therefore potentially very valuable for temperature reconstruction. However it shows a particular characteristic, that is there is a very marked increase in growth of tree rings from the late 19th century onward (above left). The next chart (above right) compares the Bristlecone Pines with the average of 10 other US sites. These do not exhibit the same characteristic. This singular increase was originally ascribed to carbon dioxide enrichment of the atmosphere. Another theory is that as the trees get old they become very twisted and this may lead to relaxation of the fibres and an apparent growth in ring size.
The fact that from the middle of the 20th century tree ring growth was less than might have been expected from the temperature record, as seen in the records for the US but general in the Northern Hemisphere, brings into question the reliability of tree rings as a proxy for temperature. If they do not accurately represent late 20th century temperatures how can we be sure they accurately represent temperatures in earlier times for which we have no instrumental corroboration? Whilst this phenomenon is well known among tree ring experts and has been described in the scientific literature, the fact that the discrepancy between narrower tree rings and higher temperatures has not always been made clear has led to lively debate.
We also examined tree rings on a country by country basis in more detail. The graphs on tree rings were based on data from 33 sources in 5 countries from the northern hemisphere and 2 from the southern hemisphere.
We also examined tree rings on a country by country basis in more detail. The graphs on tree rings were based on data from 33 sources in 5 countries from the northern hemisphere and 2 from the southern hemisphere.