GLOBAL SIMULATION OF PRECIPITATION
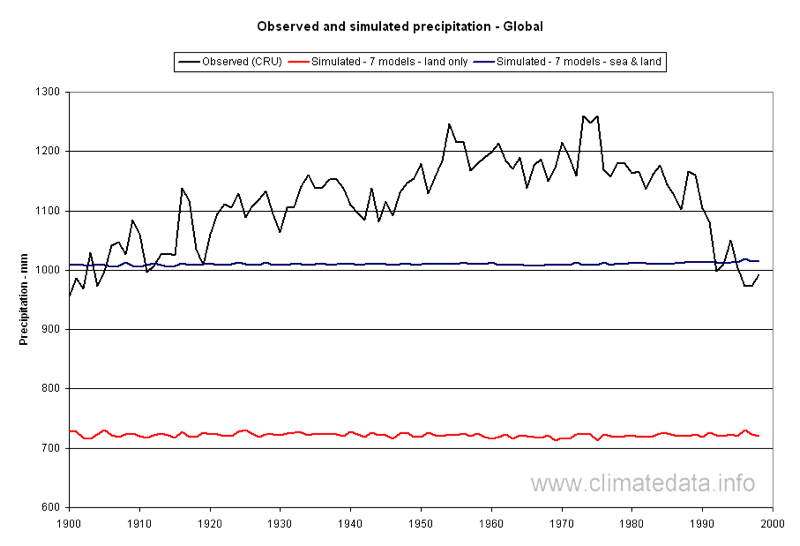
To avoid the results being biased in favour of models with a large number of simulations, the results for each model were first averaged, then the average of all models was calculated. For the simulation results we have taken the option of using data from land points only, for more appropriate comparison with the observed precipitation. In Figure 1 we present data for the period 1900 to 1998. We have used the CRU 5º gridded data set for observed precipitation over land areas.
http://www.climatedata.info/
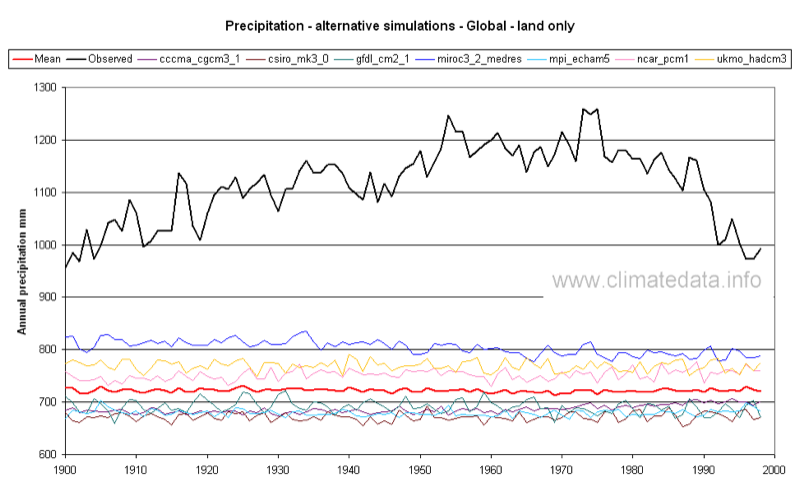
In this case, the difference between the observed and simulated lines is very marked. It should be noted that the above observed values agree with the generally accepted global average precipitation of 1000mm to 1050 mm/year. Some of the apparent discrepancy may be due to the difficulty of estimating global rainfall. The correlation between precipitation measurements falls off much more rapidly with distance than temperature and as a consequence global values are more susceptible to changes in the number and location of rain-gauges. Another possible reason might be that the areas are not necessarily exactly equivalent: the land area used in the observed data set might not correspond to that classed as land for the models. That said, other estimates of precipitation presented by the IPCC (TAR4 figure 3.12) has a similar form as shown in Figure 2.
Figure 3 shows the average for all models for land area only and for the whole world. As can be seen the simulation average for the whole world is closer to the observed average for land surfaces.
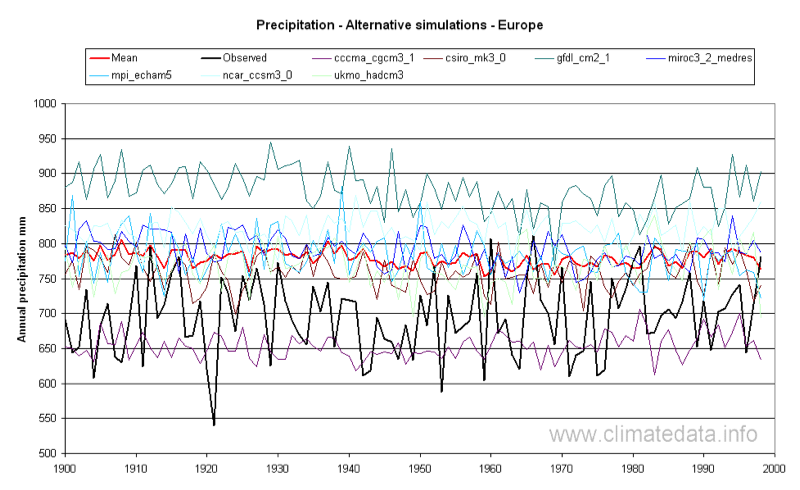
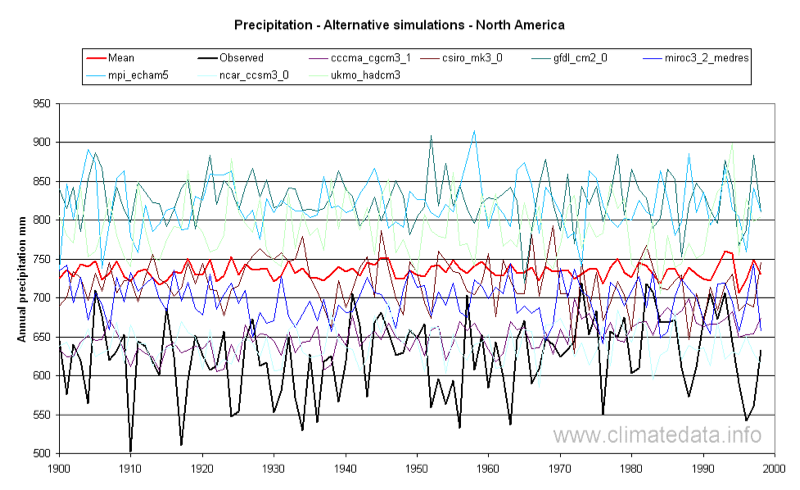
Model Simulation of Precipitation – Europe and North America
Figure 4 contains values covering the area 5ºW to 40ºE and 45ºN to 60ºN, that is most of continental Europe which has had good coverage by climate stations for the whole of the 20th century. The data in Figure 5 were calculated in a similar way for an area representing North America (30 ºN to 55 ºN and 120 ºW to 140 ºW). Two things are apparent. The first is confirmation of the IPCC statement that the variance of the simulated precipitations is less than that of the observed values (TAR4 section 9.5.4.2.1). This is generally true for individual models as well as for the mean of all models. The second is a systematic difference in the mean simulated and observed precipitation of the order of 100 mm/year. Precipitation is both a means of transferring water around the planet and, via latent heat, energy. The difference of around 100 mm, if expressed in difference of energy for evaporation, is equivalent to 7.7 W m-2 (assuming a latent heat of vaporisation of 2.45 Mj kg-1 at 20º C).