CARBON DIOXIDE
Carbon Dioxide (CO2) occurs naturally in nature. It is produced by the burning and natural decay of organic matter, by the respiration of oxygen-using organisms and by volcanoes. In a natural state the CO2 used by plants for photosynthesis is absorbed by the oceans or taken in by marine organisms which die and sink to the bed of the ocean. In recent centuries, since the start of the industrial revolution, CO2 levels have increased as a result of human activity.
Figure 1, which is based on Marland et al (Marland, G., T.A. Boden, and R.J. Andres. 2008. Global, Regional, and National CO2 Emissions. In Trends: A Compendium of Data on Global Change. Carbon Dioxide Information Analysis Center, Oak Ridge National Laboratory, U.S. Department of Energy, Oak Ridge, Tenn., U.S.A.), shows the increase in CO2 emissions from human activity since 1800. This has resulted in an increase in atmospheric CO2. The following graph (Figure 2) is based on readings of CO2 from the Mauna Loa observatory in Hawaii and measurements from the Law Dome ice core from the Antarctic.
Figure 1, which is based on Marland et al (Marland, G., T.A. Boden, and R.J. Andres. 2008. Global, Regional, and National CO2 Emissions. In Trends: A Compendium of Data on Global Change. Carbon Dioxide Information Analysis Center, Oak Ridge National Laboratory, U.S. Department of Energy, Oak Ridge, Tenn., U.S.A.), shows the increase in CO2 emissions from human activity since 1800. This has resulted in an increase in atmospheric CO2. The following graph (Figure 2) is based on readings of CO2 from the Mauna Loa observatory in Hawaii and measurements from the Law Dome ice core from the Antarctic.
http://www.climatedata.info/
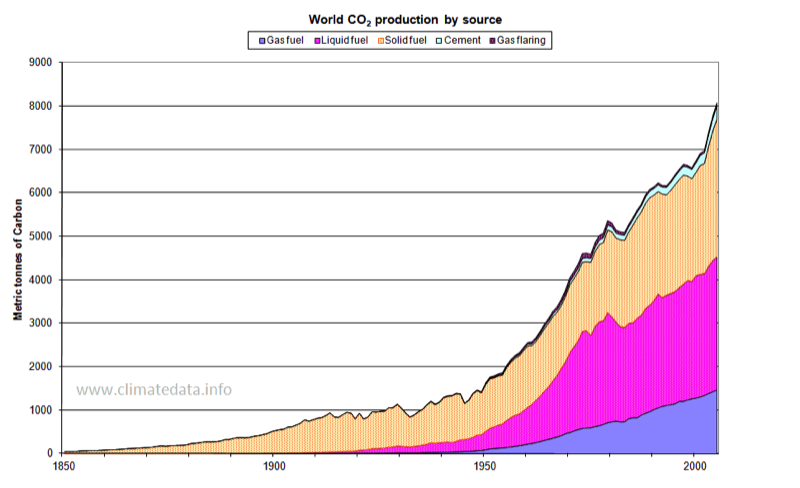
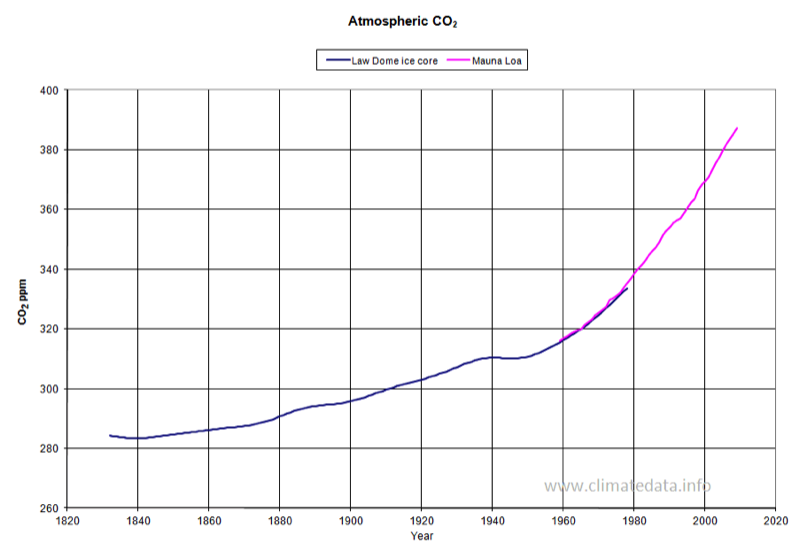
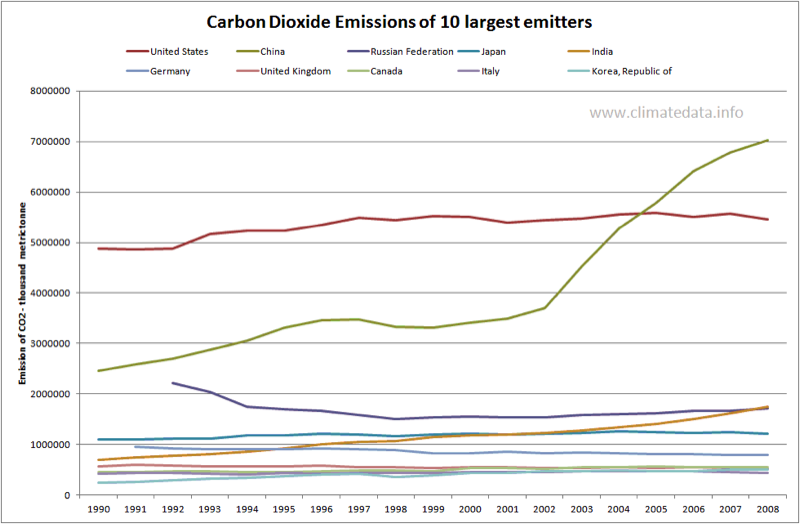
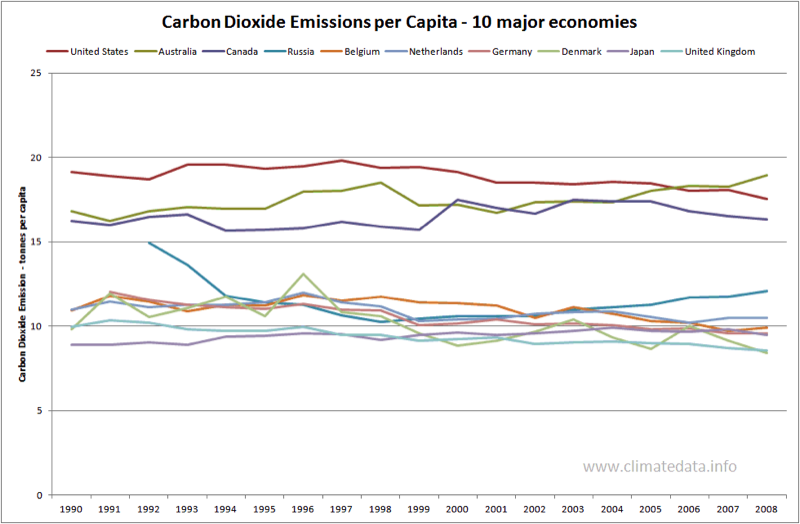
Figure 1 and Figure 2 provide information about global Carbon Dioxide production. Figure 3 shows the Carbon Dioxide emissions for the 10 largest producers (based on the average for the period 1990 to 2008). The largest producers are USA and China, with China having almost trebled its production over this period. In terms of Carbon Dioxide per capita, Figure 4 shows the 10 largest major producers. However several small countries which had high per capita usage (principally oil producing countries) have been excluded.
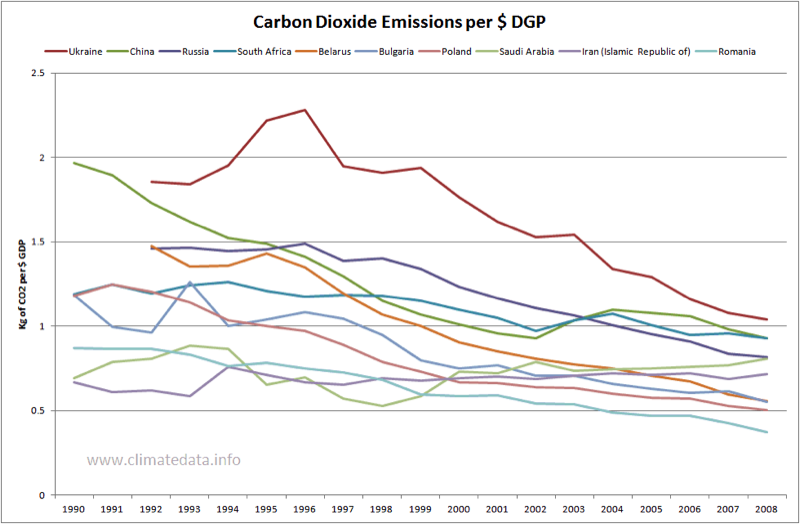
Another way of looking at Carbon Dioxide use is per $ GDP. The dollar used for these calculation is based on the PPP (purchasing power parity). This graph is based on a subset of the countries in the two previous graphs and so may exclude some countries with high use of CO2 relative to GDP. The lower the value the more efficient a country in its use of carbon dioxide. As can be seen in Figure 5, the countries of the former Soviet block had high levels of carbon dioxide use per $ GDP but have been improving rapidly.
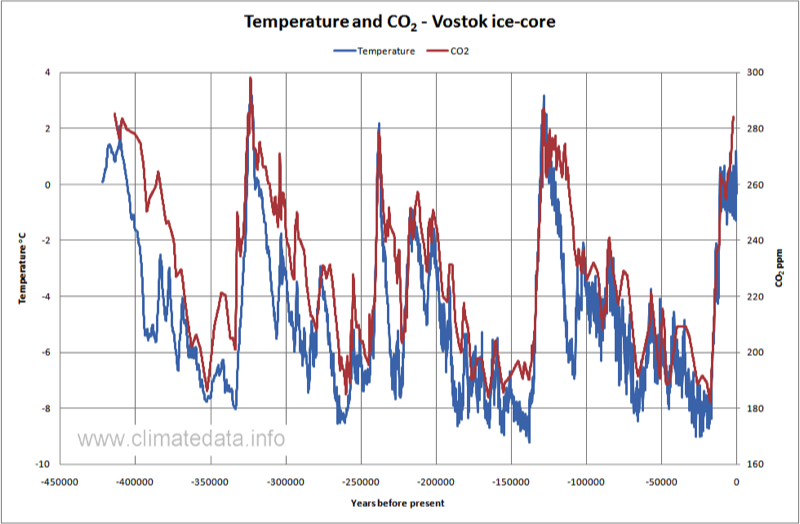
The current global levels of CO2 are probably higher than have occurred during the last few ice ages and warm interglacial periods, as shown in Figure 6, which is based on data from the Vostok Ice Core in Antarctica. It shows a maximum level in the ice core of around 300 ppm. However, present levels in the atmosphere are higher, at over 380 ppm. Over time the gas trapped in ice migrates to adjacent layers and the difference in the age of the ice and the gas trapped in it can be hundreds of years: this means the concentration of a gas in the ice is the average level over several hundred years and a rise like the recent one over a period of a few decades would not be noticed. The graph also includes temperature, which shows that temperature and CO2 rise at the same time but the CO2 lags behind temperature during the falling phase. It is now generally accepted that temperature rises as a result of the Milankovitch cycles and CO2 responds to this increase but may be an amplifying factor.